Hurricane Odile Strikes Baja California
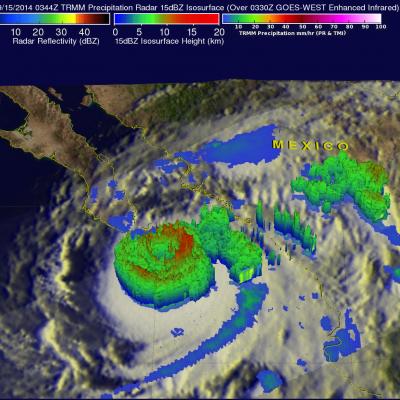
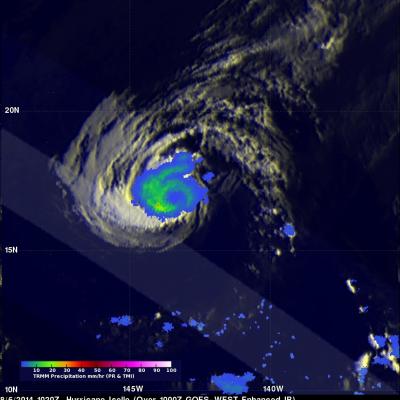
The TRMM satellite passed directly above hurricane Odile on September 15, 2014 at 0344 UTC. This was about an hour before the strong Hurricane hit Baja California near Cabo San Lucas at around 0445 UTC (September 14, 2014 9:45 PM PDT). The National Hurricane Center (NHC) hurricane discussion on September 15, 2014 said, "The estimated intensity of 110 kt at landfall ties Odile with Olivia (1967) as the strongest hurricane to make landfall in the satellite era in the state of Baja California Sur". The image above shows rainfall derived from TRMM's Precipitation Radar (PR) and Microwave Imager