tropical storms

GPM Views Tropical Storm John

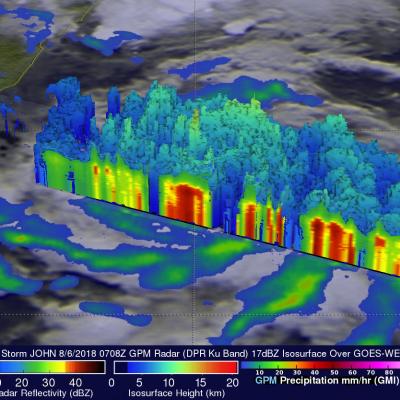
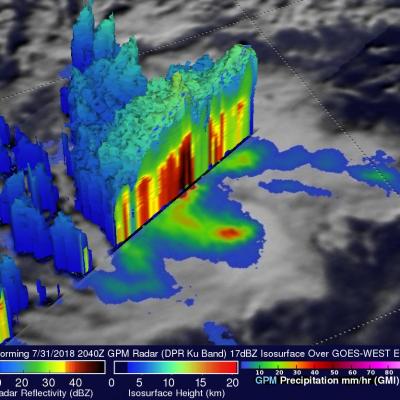
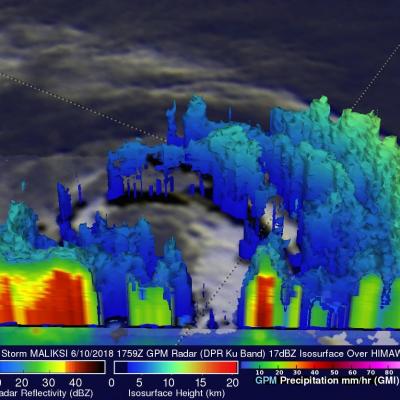
The GPM core observatory satellite had an extremely good view of tropical storm John on August 6, 2017 at 1:08 AM MDT (0708 UTC). The satellite passed right over John's center of circulation. GPM's Microwave Imager (GMI) and Dual-Frequency Precipitation Radar (DPR) instruments provided excellent coverage of precipitation associated with tropical storm John. GPM showed that the large tropical cyclone was becoming well organized and had intense rainfall within feeder bands that were spiraling toward John's center. GPM's radar (DPR Ku Band) revealed that a band of powerful storms northeast of

GPM Sees Tropical Storm Hector Forming

Tropical storm Hector was forming in the eastern Pacific Ocean southwest of Mexico when the GPM core observatory satellite passed over on July 31, 2018 at 1:40 PM PDT (2040 UTC). Hector's maximum sustained winds at that time were estimated to be about 30 kts (34.5 mph). Powerful convective storms were wrapping around the western side of the deepening tropical low's center of circulation. GPM's Dual-Frequency Precipitation Radar (DPR) instrument collected data showing that rain in some of these storms was falling at a rate of almost 198 mm (7.8 inches) per hour. The GPM satellite's radar data

Tropical Storm Ampil's Rainfall Evaluated With GPM Satellite Data

Tropical storm AMPIL was moving toward the northwest with winds of about 50 kts (57.5 mph) when the GPM core observatory satellite flew above on July 20, 2018 at 0656 UTC. Data received by the satellite's Microwave Imager (GMI) and Dual-Frequency Precipitation Radar (DPR) instruments were used in this analysis of AMPIL's precipitation. GMI and DPR showed that the northern side of the tropical storm was nearly dry and that rain bands in that area were producing only light to moderate rainfall. Moderate to heavy precipitation was found by GPM in a rain band wrapping around the southern side of

Eastern Pacific Tropical Storm Fabio Examined With GPM Satellite

NASA's GPM core observatory satellite flew above tropical storm FABIO in the eastern Pacific Ocean south of Mexico on June 30, 2018 at 10:46 PM MDT (July 1, 2018 at 0446 UTC). FABIO has continued to intensify since then and the National Hurricane Center (NHC) predicts that the tropical storm will become a hurricane later today. FABIO is then expected to become a major hurricane on July 3, 2018 and reach it's peak intensity with wind speeds of about 105 kts (121 mph). Rainfall measurements by GPM's Microwave Imager (GMI) and Dual-Frequency Precipitation Radar (DPR) instruments showed that FABIO

Tropical Storm Prapiroon Probed By GPM Core Observatory Satellite

Tropical depression 09W was located in the northwest Pacific east of the Philippines when it was upgraded today to tropical storm PRAPIROON. The tropical storm is in a favorable environment for intensification. Vertical wind shear is low above the tropical cyclone and sea surface temperatures are warm below. NASA's GPM core observatory satellite had a good view of tropical storm PRAPIROON on June 29, 2018 at 0246 UTC. PRAPIROON was just barely a tropical storm with maximum sustained wind speeds estimated at about 35 kts (40.3 mph). GPM's Microwave Imager (GMI) and Dual-Frequency Precipitation

GPM Probes Tropical Storm Maliksi

The GPM core observatory satellite had an excellent view of tropical storm MALIKSI when it passed over southern Japan on June 10, 2018 at 1759 UTC. GPM's Microwave Imager (GMI) and Dual Frequency Precipitation Radar (DPR) instruments collected data that revealed the horizontal and vertical extent of precipitation within the tropical storm. GPM's GMI showed that heavy downpours were occurring in a rain band wrapping around MALIKSI's northeastern side. GPM's radar (DPR Ku Band) found that bands of storms moving around the northwestern side of the tropical storm were dropping rain at a rate of

Tropical Storm Aletta Forms In Eastern Pacific

Early today Tropical Depression Two-E was upgraded to tropical storm Aletta. This is the first tropical storm of the 2018 eastern North Pacific season. Aletta was located well southwest of Mexico. The National Hurricane Center (NHC) predicts that Aletta will become a hurricane tomorrow as it moves westward over the open waters of the eastern North Pacific ocean. The GPM core observatory satellite passed above developing tropical storm Aletta on June 6, 2018 at 0046 UTC. This image shows precipitation measurements that were calculated from data collected by GPM's Microwave Imager (GMI) and Dual

GPM Examines Forming Subtropical Storm Alberto

At 10:00 AM CDT today the National Hurricane Center (NHC) upgraded low pressure center (90L) to Subtropical Storm Alberto. Alberto moved over the waters of the northwestern Caribbean Sea. Alberto is expected to bring heavy rainfall and flash flooding to the northeastern Yucatan, western Cuba and Florida over the Memorial Day weekend. The GPM core observatory satellite passed above the Yucatan Peninsula on May 24, 2018 a 11:19 PM EDT (May 25, 2018 at 0319 UTC). With this pass GPM saw areas of heavy precipitation within the western Caribbean and in the Gulf Of Mexico west of Cuba. GPM's Dual

Tropical Storm Tembin Rainfall Added To IMERG Analysis

Tropical storm Tembin moved over the Philippine island of Mindanao on Friday December 22, 2017. Tembin added to the death and destruction already caused by tropical storm Kai-Tak that hit the central Philippines less than a week ago. Tembin brought heavy rainfall that resulted in more deadly flooding and landslides. At least eight deaths in the Philippines have been blamed on tropical storm Tembin. Rainfall totals in this accumulation analysis were updated to include IMERG data from both tropical storms Kai-Tak and Tembin. This rainfall analysis shows rainfall accumulation estimates from IMERG

Deadly Tropical Storm Kai-tak Examined With IMERG And GPM Satellite

Tropical storm KAI-TAK was nearly stationary at times as it drenched the Philippines during the past five days. The storm caused major flooding and landslides. Many homes, roads and bridges were reported destroyed by landslides. Over 30 deaths were caused by the slow-moving tropical storm. A rainfall accumulation analysis of tropical cyclone KAI-TAK was derived from NASA's Integrated Multi-satellitE Retrievals data (IMERG) for the period from December 13-18, 2017. Tropical cylone KAI-TAK's approximate locations and positions are shown overlaid in white on this analysis. IMERG data were used to