Tropical Storm Keila In The Arabian Sea
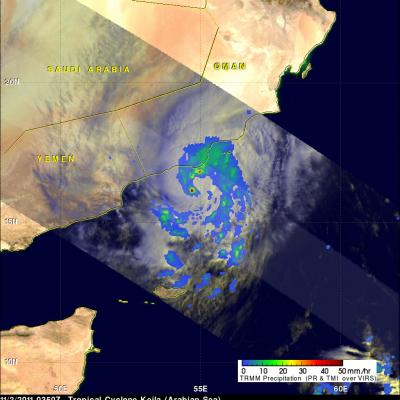
The TRMM satellite passed directly above a recently formed tropical cyclone in the Arabian Sea on November 2, 2011 at 0350 UTC. An analysis of rainfall from TRMM's Microwave Imager (TMI) and Precipitation Radar (PR) instruments is shown in the image on the upper left. TRMM data shows that rainfall rates with tropical storm Keila ranged from light to moderate along the south-eastern coast of Oman. Moderate to heavy rainfall was revealed to be spiraling into Keila's center of circulation in the Arabian Sea near the southeastern coast of Oman. The image above is a rendering that shows Keila's