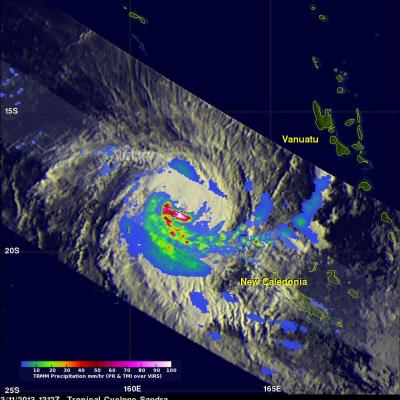
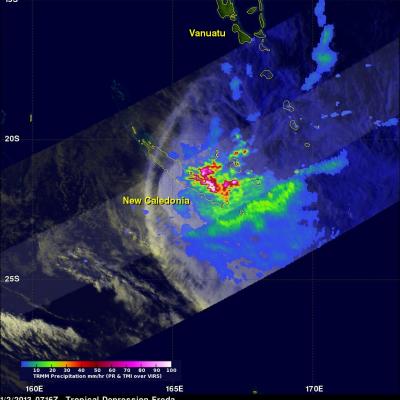
Tropical Cyclone Sandra Nearing New Caledonia
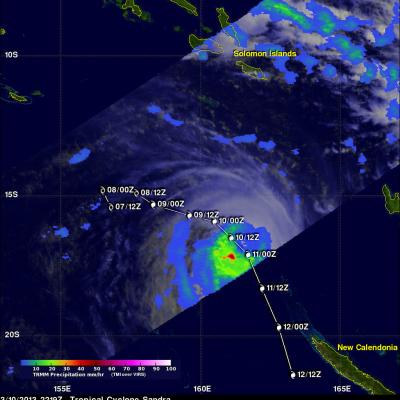
Tropical cyclone Sandra formed in the Coral Sea south off the Solomon Islands on March 7, 2013. Sandra intensified over the open waters of the Coral Sea and became a very powerful tropical cyclone with winds of about 110 kts (~127 mph). Sandra has started weakening but is predicted to buffet northern New Caledonia with tropical storm force winds on March 12, 2013. Sandra's approximate past and forecast locations are shown overlaid in white. The TRMM satellite passed above Sandra on March 10, 2013 at 2219 UTC. A rainfall analysis using data captured by TRMM's Microwave Imager (TMI) instrument