Tropical Cyclone Mekunu Examined With GPM Satellite

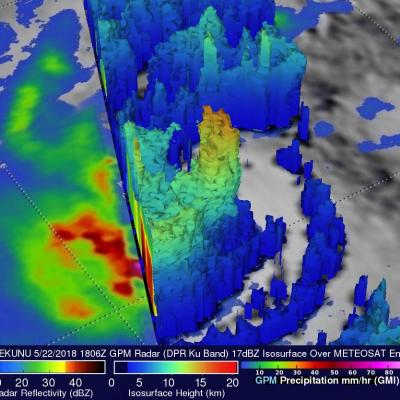
The second tropical cyclone in less than a week has formed in the western Arabian Sea early on May 22, 2018. This tropical cyclone called MEKUNU is intensifying as it heads toward Oman. The Joint Typhoon Warning Center (JTWC) predicts that MEKUNU will have winds of about 85 kts (98 mph) when it hits southwestern Oman in about three days. This will make it the equivalent of a category two hurricane on the Saffir-Simpson hurricane wind scale. Tropical cyclone MEKUNU follows on the heels of destructive and deadly tropical cyclone SAGAR that just made landfall over northwestern Somalia a few days

Heavy Rainfall Across the U.S. Measured from Space

For close to two weeks the combination of a nearly stationary front and tropical moisture caused almost continuous precipitation over much of the Mid-Atlantic. Record amounts of rain fell over the eastern United States with over a foot of rain reported in some parts of the Mid-Atlantic. The excessive rain led to flooding along several rivers including the Potomac river. This image shows anomalous rainfall for the period from May 11-20, 2018. This analysis used climatology data that were based on measurements by the Tropical Rainfall Measuring Mission (TRMM) satellite from 1997- 2015. The TRMM

Replacement GPM Ka/Ku L1B products (2018-05-18) for orbit 23969

PPS received replacement GPM Ka/Ku L1B products from JAXA and will reprocess the affected data including Level 2 and 3 data. If you have already obtained products with orbit#23969 from our archive or through a standing order, etc., please discard and use the replacement products. PPS has replaced the following GPM Ka/Ku L1B data: GPMCOR_KUR_1805180849_1022_023969_1BS_DUB_05A.h5 GPMCOR_KAR_1805180849_1022_023969_1BS_DAB_05A.h5 PPS will reprocess the following L2-3 downstream products: 2AKa 2A.GPM.Ka.V7-20170308.20180518-S084951-E102226.023969.V05A.HDF5 2AKu 2A.GPM.Ku.V7-20170308.20180518

Tasmania's Flooding Rainfall Measured With NASA's IMERG

Last week Tasmanian's were evacuated, businesses were flooded and cars washed away as extreme rainfall accompanied a strong cold front and a low pressure system that spawned violent storms. Hobart city, located in southeastern Tasmania, received record breaking rainfall of more than 100 mm (3.93 inches) in a single day. A strong pressure gradient developed between the complex low pressure center over Tasmania and high pressure that was moving eastward over the Great Australian Bight (Southern Ocean). This strong pressure gradient resulted in destructively high south-easterly winds over

Announcement of Swath-Based Analysis Tool

The STORM Swath-Based Analysis Tool ( https://storm.pps.eosdis.nasa.gov/storm/Analysis.jsp) is a better way to explore and order targeted Level 2 data. Select one or more instruments from a list going back to the beginning of the TRMM mission, provide a date range, and input a geographic region of interest. Once you hit "Get Granules for Chart," a graph will appear and data points will begin to display. These points represent the mean precipitation rate value for all of the pixels for that orbit of that instrument over that geographic region. Once the graph loading is paused or complete