GPM Sees Tropical Cyclone Kelvin Develop Cloudless Eye After Landfall in Australia
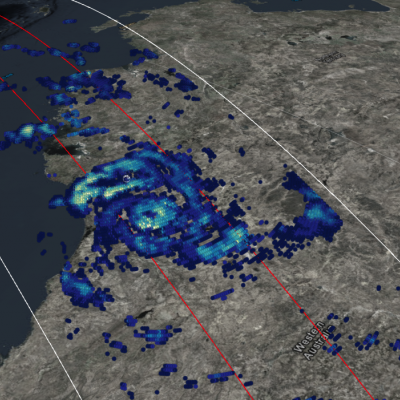
Tropical Cyclone Kelvin struck Northwestern Australia with winds reaching 54 knots as it crossed the Kimberley Coast. It brought flooding rains and damaging winds to the settlements and mining companies of the region. The storm intrigued meteorologists as it only developed a cloudless eye after making landfall, believed in part due to the heat flux generated by the warm desert the storm traveled over. View this visualization in full screen using STORM Event Viewer