Floods

To better understand and predict floods scientists have developed hydrological models based on how much rainfall occurs and where the water will likely go once it hits the ground. They use several satellite precipitation datasets within these models to provide near real-time estimates of when and where areas may flood on local, regional, and global scales. 

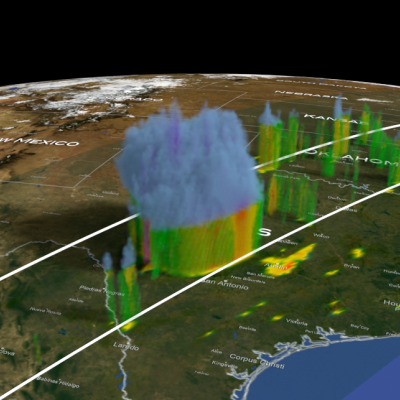
3D view of the Texas storms from the GPM satellite
Over the fourth of July weekend, the Texas Hill Country was devastated by a powerful flash flood event. River levels rose rapidly, on the order of 20 feet or more in 1 to 2 hours or less, all along the upper part of the Guadalupe River. The main flood event started overnight and continued throughout the morning of July 4, resulting in widespread destruction, hundreds of water rescues, many deaths, and numerous people still reported as missing. The Hill Country can be susceptible to flash floods as water tends to run off rather than being absorbed by the soil and plants. The culprit for this
Screenshot of IMERG rain rates on October 29, 2024
During the 10-day period from Oct. 26 through Nov. 4, 2024, parts of central-eastern and southern Spain saw unusually heavy flooding that resulted in heavy infrastructure damage and over 200 fatalities, according to the Associated Press. In this animation, NASA’s IMERG multi-satellite data product shows estimated rain rates (blue/yellow shading) and accumulations (green/purple shading) from the flooding rainfall. Cloudiness is also shown in white/gray shading, from geosynchronous infrared satellite observations. Download video (right-click -> "Save As") The flooding was caused by heavy
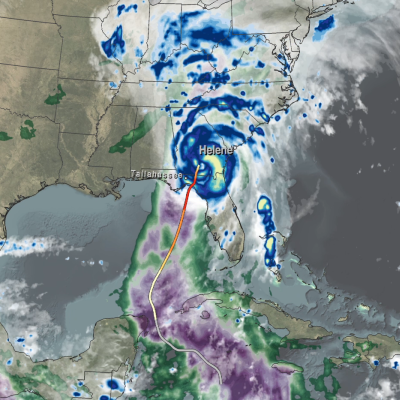
Map of IMERG rainfall totals from Hurricane Helene.
After tracking through the eastern Gulf of Mexico and battering much of the west coast of Florida with strong winds and storm surge, Hurricane Helene made landfall in the Big Bend region of Florida’s northwest coast at 11:10 pm EDT about 10 miles west-southwest of Perry, Florida, as a powerful Category 4 hurricane with maximum sustained winds reported at 140 mph by the National Hurricane Center (NHC). Hurricane Idalia, a strong Category 3 storm at the time, also made landfall in the Big Bend last year. Animation of NASA IMERG precipitation rates and totals from Hurricane Helene from Sept. 23 -
A grid showing many examples of the data GPM has collected in its 10 years of operation.
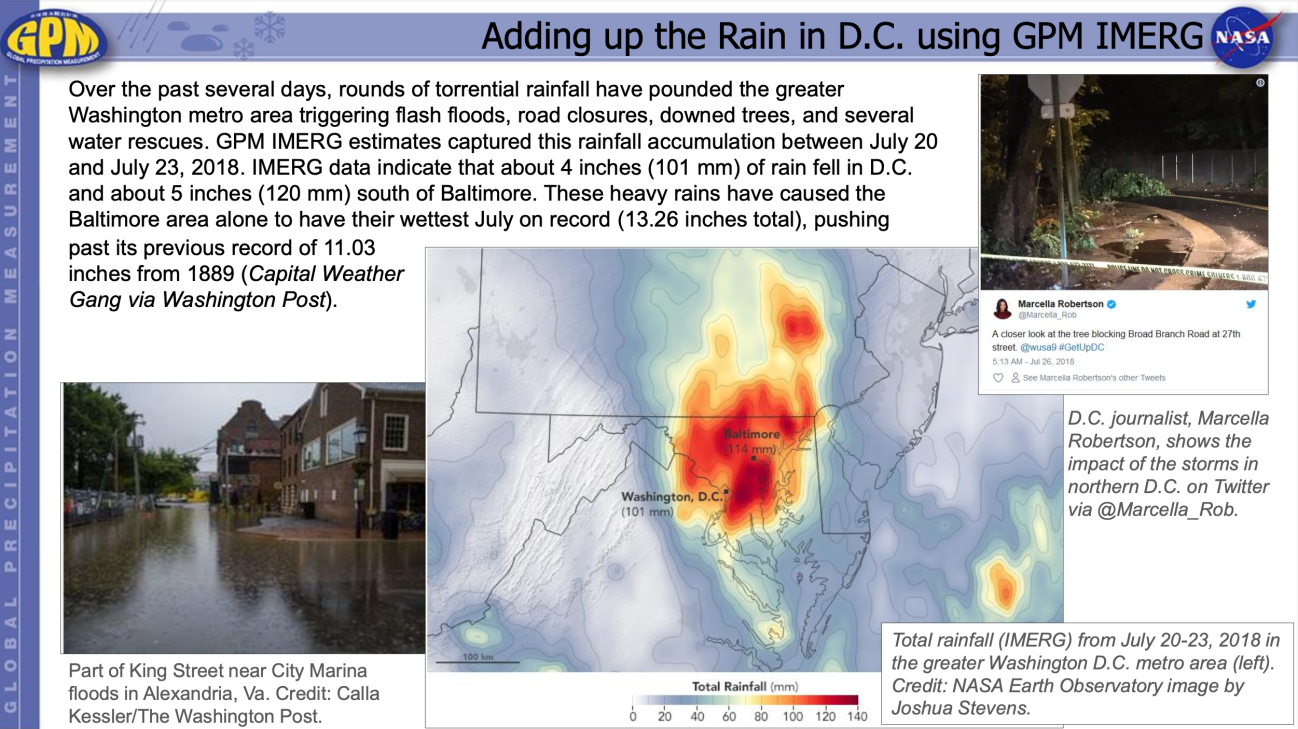
The joint NASA / JAXA Global Precipitation Measurement (GPM) mission has been tracking rain and snow around the globe for over 10 years, providing valuable insights into Earth's weather and climate. Now in its tenth year of operation, we look at ten events brought to light by this groundbreaking mission.
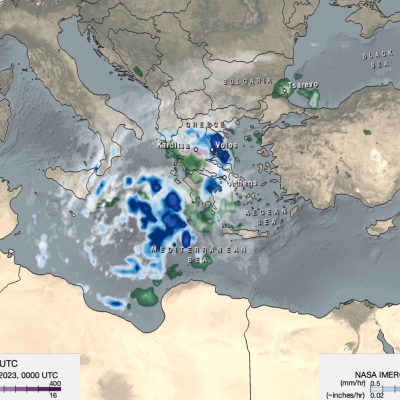
Map of IMERG precipitation estimates from recent flooding rainfall in Greece.
On Sept. 4, 2023, a low-pressure system developed over southeastern Europe that would lead to devastating floods over Greece and other parts of the region. The system was given the name “Daniel” by local meteorological agencies. Daniel was dynamically driven by strong cyclonic flow in the upper-level winds over southeastern Europe. The upper-levels winds combined with low-level winds from the northeast which supplied moisture from the unusually warm waters of the Aegean and Black Seas to central Greece. According to satellite infrared and microwave estimates from NASA's MUR and NOAA’s OISST v2
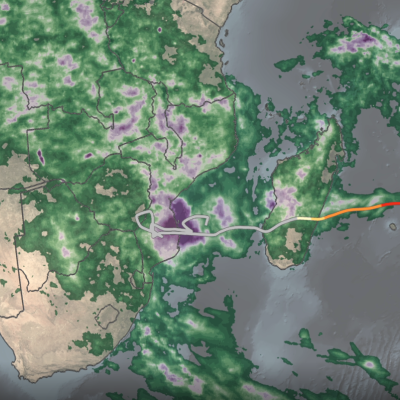
IMERG rainfall totals from Cyclone Freddy
Tropical Cyclone Freddy first made landfall along the east coast of Madagascar just north of the town of Mananjary on Feb. 21, 2023, as a Category 3 cyclone with average winds reported at ~81 mph (130 km/h) and gusts up to ~112 mph (180 km/h). After crossing over Madagascar Freddy continued westward over the Mozambique Channel before making landfall again along the east coast of Mozambique just south of Vilankulos as a moderate tropical storm with sustained winds estimated at 50 mph. Despite being weaker at landfall, Freddy caused widespread flooding across parts of Mozambique due to the storm stalling out near the coast after making landfall. Incredibly, Freddy drifted back out over the Mozambique Channel, nearly making landfall along the southwest coast of Madagascar. It then changed direction, re-intensified, weakened, re-intensified one last time, and made landfall once again on March 11 near Quelimane, Mozambique, as a Category 1 cyclone with sustained winds reported at 90 mph.
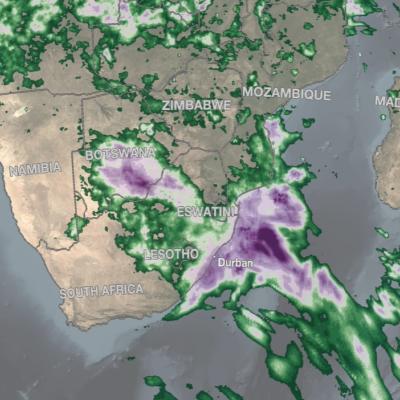
IMERG rainfall totals in South Africa, April 5 - 18, 2022.
An upper-level area of low pressure tapped into the warm waters of the South Indian Ocean to bring heavy rains and flooding to parts of South Africa during the second week of April. The event unfolded when an upper-level trough of low pressure embedded within the midlatitude westerlies traversed the southern part of Africa from west to east. As the trough approached the east coast of South Africa, an area of low pressure became detached from the main flow, this “cut off” low then drifted over the warm waters of the Agulhas Current, which channels warmer waters from the tropical Indian Ocean
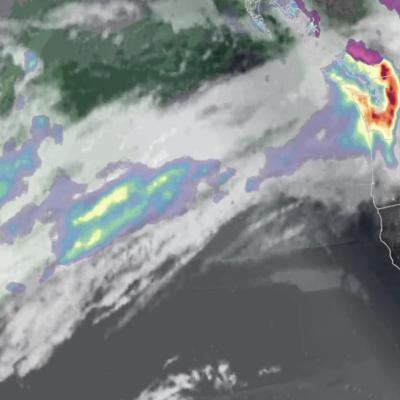
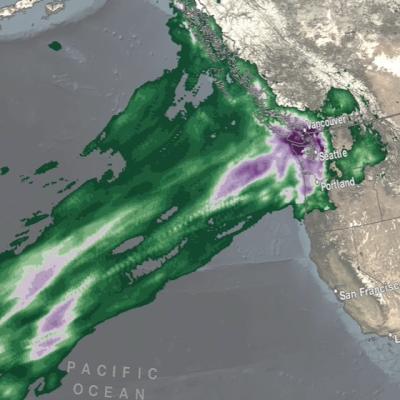
IMERG rainfall totals from the Nov. 2021 atmospheric river.
The Pacific Northwest coast saw two atmospheric rivers (ARs) bring heavy rains from Nov. 10-16, 2021, resulting in severe flooding, landslides, and damage to infrastructure in the British Columbia province of Canada. ARs are long, narrow corridors of water vapor that travel vast distances above the ocean from warm, tropical regions to higher latitudes, where they often release their moisture as rainfall when they reach land areas. While ARs occur across the globe, this year has been notable for several strong events that have impacted the Pacific Northwest coast. The two atmospheric rivers in
IMERG Precipitation Totals from Eastern Australia, March 16 - 23, 2021
During the week ending on March 23, 2021, two locations in Australia experienced unusually high rainfall totals. According to news reports a persistent system brought flooding rains to Australia's east coast from Brisbane to Sydney and points further south. The preliminary estimate from NASA's multi-satellite global precipitation analysis is that more than 24 inches fell just off the coast of Australia in 7 days with accumulations in coastal areas exceeding 16 inches. Near the Strzelecki Desert in central Australia, a storm system brought 8 inches of precipitation during the same 7-day period. Most of the rain fell during a 3-day period (0000 UTC on 20 March to 2359 UTC on 22 March).