GPM Applications: Weather

Using GPM Data for Weather, Climate, and Land Surface Modeling

Using GPM Data for Weather, Climate, and Land Surface Modeling

Variations in rain, snow, and other forms of precipitation are an integral part in everyday weather and long term climate trends. Initialization of short-term weather and long-term climate models with accurate precipitation information enhances their prediction skills and extends their skillful lead times. To get the resolution and temporal coverage to measure precipitation across the globe, we often rely on satellite information. Satellite data can play a fundamental role in our ability to monitor and predict weather systems as well as to forecast future changes to our climate and land surface. Satellite data from GPM’s suite of precipitation products are integrated into numerical weather prediction models that are operated by operational partners to provide and improve the observations from which the forecasts are then generated. Similarly, climate and land surface models use satellite precipitation observations from GPM to describe the conditions that exist today in order to project how conditions may change in the future. The Weather, Climate, and Land Surface Modeling applications area promotes the use of GPM data to help monitor existing weather activity and model future behavior of precipitation patterns and climate.

Overview

Variations in rain, snow, and other forms of precipitation are an integral part in everyday weather and long term climate trends. Initialization of short-term weather and long-term climate models with accurate precipitation information enhances their prediction skills and extends their skillful lead times. To get the resolution and temporal coverage to measure precipitation across the globe, we often rely on satellite information. Satellite data can play a fundamental role in our ability to monitor and predict weather systems as well as to forecast future changes to our climate and land surface. Satellite data from GPM’s suite of precipitation products are integrated into numerical weather prediction models that are operated by operational partners to provide and improve the observations from which the forecasts are then generated. Similarly, climate and land surface models use satellite precipitation observations from GPM to describe the conditions that exist today in order to project how conditions may change in the future. The Weather, Climate, and Land Surface Modeling applications area promotes the use of GPM data to help monitor existing weather activity and model future behavior of precipitation patterns and climate.

Sections

GPM Data for Decision Making

Image

NOAA’s Climate Prediction Center (CPC) issues extended range outlook maps for 6-10 days in the future. The above figure shows a 6-10 forecast of precipitation probability for the first week of October 2018. This product complements short-range weather forecasts issued by other components of the National Weather Service. Credit: NOAA/NCEP/CPC
 

Numerical weather prediction (NWP) is the use of computer models to predict upcoming weather. Specifically, NWP centers rely on microwave-based satellite rainfall information, such as data retrieved from GPM’s GMI, to improve short- to long-term weather forecasts and correct track forecasts for tropical cyclones. In addition, NWP centers create precipitation products for “nowcasting” weather in the immediate 1-5 hours (e.g. using near-real-time rainfall data from GPM) to meet the needs of a wider user community, including weather forecasters, hydrologists, farmers, numerical modelers, the military and the climate community. Methods for integrating rainfall data are constantly evolving and advancing, and with GPM’s advanced instruments, scientists can influence and enhance their scientific research and benefit socioeconomic activities.

Image

European Centre for Medium-Range Weather Forecast (ECMWF) Seasonal Forecast of precipitation probability. Percent probability is determined by using the predictive anomaly relative to 24 years of observed precipitation from 1993-2016. Credit: European Centre for Medium-Range Weather Forecast
 

To understand the changing climate and make future climate predictions, scientists need to use sophisticated computer models to recreate Earth’s climate conditions. Understanding current rainfall and snowfall variability, among other climate factors on regional and global scales, helps scientists model future behavior of precipitation patterns and climate. But for a system as complicated as the Earth, the models are only as good as the data provided. Satellite precipitation measurements from GPM and its predecessor TRMM provide global scale observational data sets that are comprehensive and consistent over long time periods, two characteristics scientists need to understand the relationships between different parts of the climate system. Specifically, organizations use GPM and TRMM data as input to verify and validate their seasonal and climate model simulations. The ultimate goal is to be able to predict changes in climate on time scales as short as the next hurricane season and as far into the future as changes that may occur in the coming decades or centuries. 

Image

Climate change may lead to an increase in temperatures and a decrease in snowpack within the Absaroka Range, found at the eastern edge of Yellowstone National Park. Credit: National Park Service/Neal Herbert
 

Precipitation is the fundamental driver of land surface hydrological processes and a key component of the terrestrial water cycle, which in turn affects the functioning of atmospheric and climate processes. High-resolution modeling of land surface hydrological processes requires detailed rainfall estimates as inputs to improve understanding of the state of the water cycle and impacts on land-surface processes during extreme events. Satellite precipitation data from GPM is integrated into land surface models to study surface features and how they change due to manmade and natural conditions such as urbanization and erosion. The use of GPM precipitation data together with other satellite data including soil moisture within land surface models will improve weather and hydrological prediction, which will help city planners and even decision makers save lives. 

Weather & Climate Featured Resources

Jump to a Year

2022 | 2021 | 2020 | 2019 | 2018

2017 | 2016 | 2015 | 2014 | 2013

2012 | 2011 | 2010 | 2009 | 2008

2007 | 2006 | 2005 | 2004 | 2003

2002

Weakening Tropical Storm Bill Seen By GPM JacobAdmin Thu, 06/18/2015
The GPM core observatory satellite had a good daytime look at tropical storm Bill on Wednesday June 17, 1015 at 1552 UTC ( 10:52 AM CDT). GPM saw that an area of heavy rain on Bills northern side was then moving into southern Oklahoma. The Dual-Frequency Precipitation Radar (DPR) on board the satellite measured rain dropping at a rate of over 50 mm (almost 2 inches) per hour in some intense storms. GPM radar data (Ku band) were also used to look at the 3-D structure and storm top heights within storms associated with tropical storm Bill. This image shows that in some areas the dissipating
IMERG Sees Gulf Rainfall With Tropical Storm Bill JacobAdmin Wed, 06/17/2015
Tropical storm Bill became the second named tropical cyclone in the Atlantic Ocean Basin when it formed in the western Gulf Of Mexico on June 16, 2015. Data from the NASA's Integrated Multi-satellitE Retrievals for GPM (IMERG) was used in this analysis to estimate rainfall from Tropical Storm Bill. Precipitation was analyzed from the time when tropical storm Bill was forming in the Gulf Of Mexico on Monday June 15, 2015 until early this morning at 0800 UTC (4 AM CDT). The storm was dropping heavy rainfall over Texas this morning but this analysis indicates that the heaviest rainfall totals, up

Tropical Storm Carlos Viewed By GPM

Tropical storm Carlos is the third tropical cyclone in what promises to be a busy 2015 eastern Pacific hurricane season. 
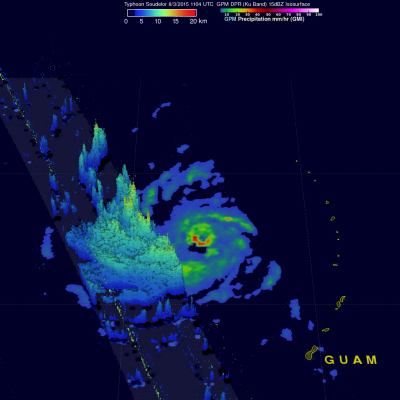
The GPM core observatory satellite flew directly above Carlos on June 12, 2015 at 0716 UTC. GPM's Microwave Imager (GMI) and Dual-Frequency Precipitation Radar (DPR) instruments showed that heavy rain was falling in a band of powerful storms to the southeast of the tropical storm's center of circulation. Rainfall was measured by GPM radar (Ku band) falling at a rate of almost 70 mm (2.8 inches) per hour in Carlos' most intense areas of rainfall. Those same radar data were

Tropical Cyclone Ashobaa Contains Powerful Storms

The GPM core observatory had another excellent view of tropical cyclone Ashobaa in the Arabian Sea over on June 8, 2015 at 2131 UTC. As expected, Ashobaa was more powerful than when seen by GPM earlier in the day. GPM's Microwave Imager (GMI) and Dual-Frequency Precipitation Radar (DPR) instruments showed that rain was falling at a rate of over 70.5 mm (about 2.8 inches) per hour in bands of storms west of the center of circulation. Very powerful storms were seen west of tropical cyclone Ashobaa's center of circulation by GPM's Ku Band Radar. A 3-D view constructed from GPM's Ku band radar

GPM Flys Over Tropical Cyclone In Arabian Sea

A rare tropical cyclone in the Arabian Sea west of India was seen by the GPM core observatory satellite when it flew over on the morning of June 8, 2015 at 0811Z. Tropical cyclone Ashobaa (TC01A) had sustained wind speeds of about 40 kts (46 mph) when the satellite passed over head. GPM's Microwave Imager (GMI) and Dual-Frequency Precipitation Radar (DPR) instruments measured rain falling at a rate of over 60 mm (2.3 inches) per hour in strong thunderstorms southwest of the storm's center of circulation. A 3-D view was constructed using data from DPR Ku band radar data. This 3-D view of GPM

The most detailed view of our daily weather has been created using NASA's newest extended precipitation record known as the Integrated Multi-satellitE Retrievals for GPM, or IMERG analysis. The IMERG analysis combines almost 20 years of rain and snow data from the Tropical Rainfall Measuring Mission (TRMM) and the joint NASA-JAXA Global Precipitation Measurement mission (GPM). The daily cycle of weather, also known as the diurnal cycle, shapes how and when our weather develops and is fundamental to regulating our climate.

Music Credits: "Battle For Our Future" and "Wonderful Orbit" by Tom...

NASA engineer Manuel Vega can see one of the Olympic ski jump towers from the rooftop of the South Korean weather office where he is stationed. Vega is not watching skiers take flight, preparing for the 2018 PyeongChang Winter Olympics and Paralympic games. Instead, he’s inspecting the SUV-sized radar beside him. The instrument is one 11 NASA instruments specially transported to the Olympics to measure the quantity and type of snow falling on the slopes, tracks and halfpipes. NASA will make these observations as one of 20 agencies from eleven countries in the Republic of Korea as participants...

NASA researchers now can use a combination of satellite observations to re-create multi-dimensional pictures of hurricanes and other major storms in order to study complex atmospheric interactions. In this video, they applied those techniques to Hurricane Matthew. When it occurred in the fall of 2016, Matthew was the first Category 5 Atlantic hurricane in almost ten years. Its torrential rains and winds caused significant damage and loss of life as it coursed through the Caribbean and up along the southern U.S. coast. 

Music: "Buoys," Donn Wilkerson, Killer Tracks; "Late Night Drive," Donn...

NASA scientists can measure the size and shape distribution of snow particles, layer by layer, in a storm. The Global Precipitation Measurement mission is an international satellite project that provides next-generation observations of rain and snow worldwide every three hours.

The Global Precipitation Measurement (GPM) Core Satellite captured a 3-D image of a winter storm on February 17, 2015, that left six to 12 inches of snow over much of Kentucky, southwestern West Virginia, and northwestern North Carolina. The shades of blue in the 3-D image indicate rates of snowfall with more intense snowfall shown in darker blue. Underneath where it melts into rain, the most intense rainfall is shown in red. You can see a lot of variation in precipitation types over the southeastern portion of the United States.

The GPM Core Observatory carries two instruments that show the...

Hide Body

Hide Date