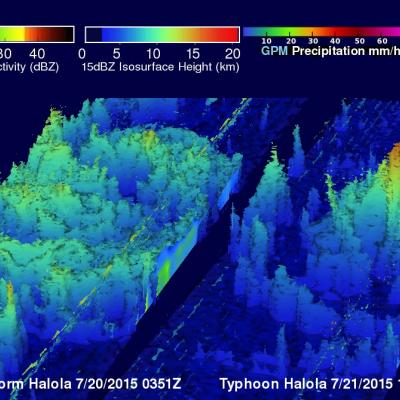
Typhoon Halola Threatening Japan
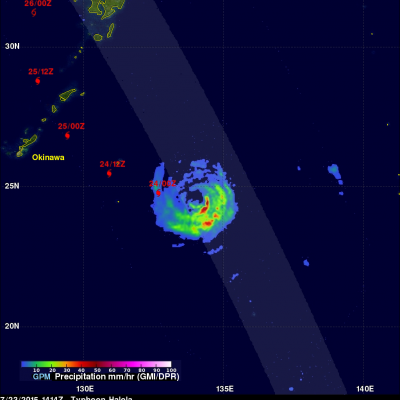
Typhoon Halola is predicted by the Joint Typhoon Warning Center (JTWC) to weaken to tropical storm intensity over the next couple days while passing to the north of Okinawa, Japan. Recent predictions of Halola's track are shown overlaid in red. The GPM core observatory's Microwave Imager (GMI) and Dual-Frequency Precipitation Radar (DPR) measured rainfall as it flew directly over typhoon Halola in the western Pacific Ocean on July 23, 2015 at 1414 UTC. A simulated 3-D flyby around typhoon Halola was made from GPM Radar data (Ku Band). This animation shows that that Halola's eye wall was