Tropical Storm Ela To Pass Near Hawaiian Islands
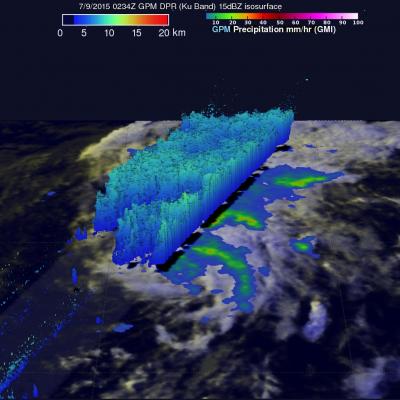
A tropical storm called Ela formed east-southeast of the Hawaiian Islands on July 8, 2015 and is expected to pass to the north of the island chain this weekend. GPM had a good view of Ela as the satellite flew over the forming tropical storm on July 8, 2015 at 1316 UTC (3:16 AM HST). The satellite passed above Ela again on July 9, 2015 at 0234 UTC (July 8, 2015 4:34 PM HST) showing that rainfall bands associated with the tropical cyclone were better organized. GPM's Microwave Imager (GMI) and Dual-Frequency Precipitation Radar (DPR) instruments found today that rainfall was falling at a rate