Super Typhoon Trami's Rainfall Examined By GPM
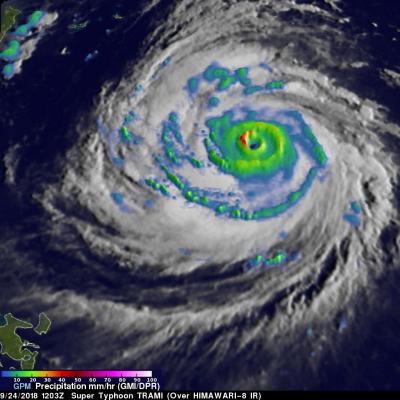
The GPM core observatory satellite probed super typhoon TRAMI when it traveled above the northwestern Pacific Ocean on September 24, 2018 at 1203 UTC. At that time TRAMI had maximum sustained winds estimated at 130 kts (150 mph). This image shows rainfall measurements that were made using data collected by GPM's Microwave Imager (GMI) and Dual-Frequency Precipitation Radar (DPR) instruments. GPM's GMI showed the locations of extremely heavy rainfall in the super typhoon's well defined circular eye. GPM's radar (DPR Ku Band) coverage was limited because it's swath only included storms on the