GPM Sees Hurricane Lane Threatening Hawaiian Islands With Heavy Rainfall
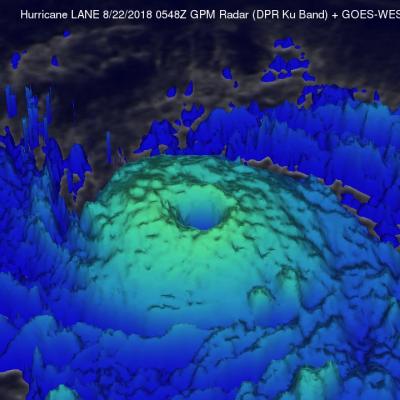
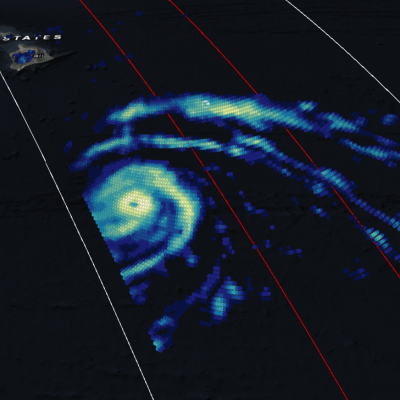
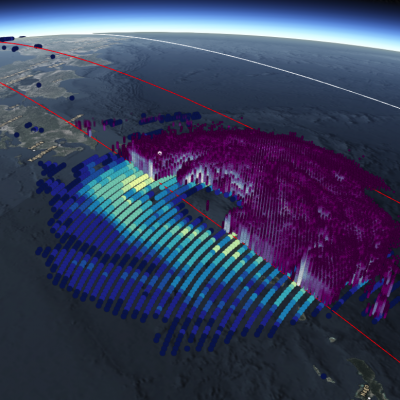
The GPM core observatory satellite flew over hurricane LANE on August 21, 2018 at 7:48 PM PST (August 22, 2018 at 0548 UTC). At that time LANE was located about 316 nautical miles (585.2 km) from Hilo, Hawaii. Hurricane LANE is one of the strongest tropical cyclones to move into the Hawaiian Islands. At the time of this GPM pass LANE was a category five on the Saffir-Simpson hurricane wind scale with winds of about 140 kts (161 mph). This analysis shows precipitation derived from data collected by the GPM satellite's Microwave Imager (GMI) and Dual-Frequency Precipitation Radar (DPR)