GPM Views Super Typhoon Maria Near Guam
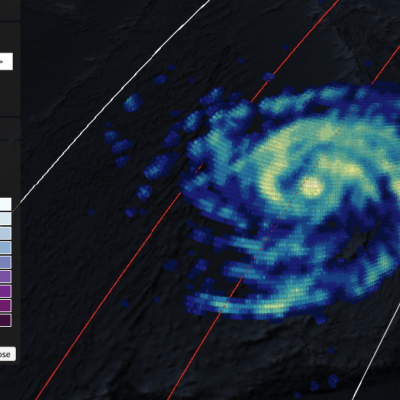
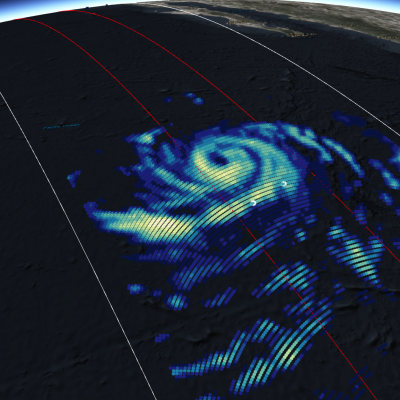
View full screen in STORM Event Viewer. Rapidly intensifying after its genesis near Guam, Super Typhoon Maria featured winds near 130 knots as it spiraled through the waters of the Western Pacific Ocean. The DPR scan indicates deep convection in several parts of the outer bands, with the most intense precipitation rates from GMI concentrated in the eyewall. Maria is expected to continue intensifying over the next three days, then weaken slightly as it crosses through the Ryukyu Islands, possible near Okinawa. The long range forecast has it making landfall in Northern China, possibly still as a