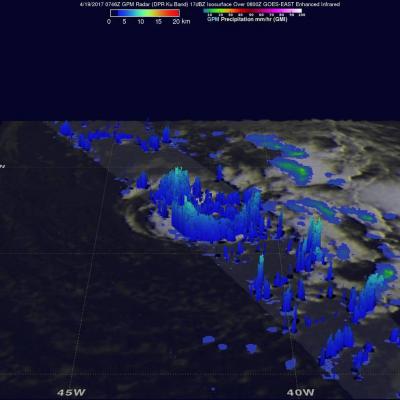
Arlene Becomes Rare Atlantic Tropical Cyclone
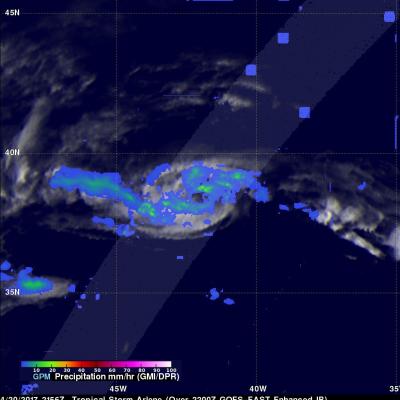
Tropical storms are quite rare in the Atlantic at this time of the year, which is why the formation of Tropical Storm Arlene in the north Central Atlantic yesterday, Thursday April 20th at 5:00 pm EDT, was so unusual. The National Hurricane Center (NHC) noted that Arlene became only the 2nd tropical storm to form in the Atlantic during the month of April in the entire satellite era, the other being Tropical Storm Ana back in 2003. GPM captured this timely image of Arlene just after the NHC officially designated it to be a tropical storm. The image was taken at 21:56 UTC (5:56 pm EDT) on