Powerful Tropical Cyclone Enawo Threatens Madagascar
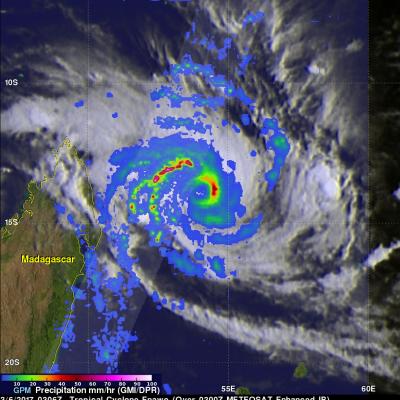
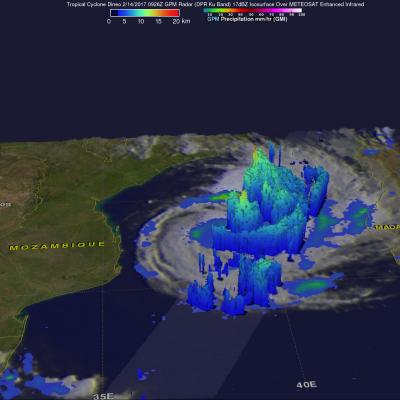
Tropical cyclone Enawo has continued to intensify while moving toward Madagascar. Enawo had winds of about 90 kts (103.5 mph) when the GPM core observatory satellite flew over on March 6, 2017 at 0306 UTC (0606 AM local time). These powerful winds make Enawo the equivalent of a category two hurricane on the Saffir-Simpson Hurricane wind scale. GPM revealed that the tropical cyclone had heavy rainfall in distinct feeder bands on the western side and in the northeastern side of the eyewall. Precipitation was measured by GPM's DPR falling at a rate of over 220 mm (8.7 inches) per hour in intense