Deadly Torrential Rain Hits Southern Thailand
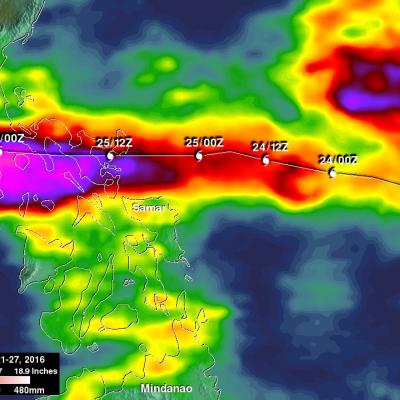
Widespread flooding has recently caused the deaths of dozens of people in southern Thailand. Frequent and persistent downpours have resulted in record rainfall totals. NASA's Integrated Multi-satellitE Retrievals for GPM (IMERG) were used to estimate the total amount of rain that fell over southern Thailand during the past week. Extreme rainfall totals of over 700 mm (27.6 inches) were shown over the Gulf of Thailand. The highest rainfall total estimates over land were greater than 500 mm (19.7 inches) on the eastern coast of the Malay Peninsula in the Bang Saphan district. Rainfall has