Intensifying Tropical Storm Nock-ten Heads Toward Philippines
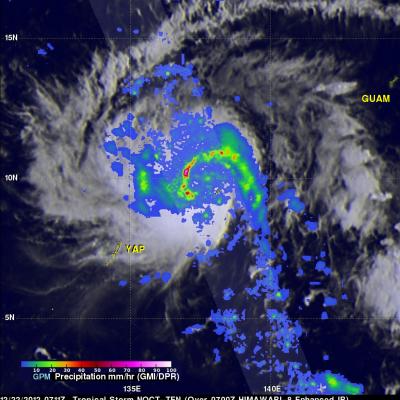
Heavy precipitation and strong winds from typhoon Nock-ten are expected over the Philippines for several days as the country is celebrating the Christmas holiday. Tropical storm Nock-ten is predicted by the Joint Typhoon Warning Center (JTWC) to strengthen into a powerful typhoon with winds of about 105 kts (121 mph) before it reaches the Philippines. Nock-ten is predicted to weaken after hitting the eastern Philippines but still have winds of over 80 kts (92 mph) as it travels close to Manila, the country's capital. The GPM core observatory satellite had a good view of Nock-ten when it passed