GPM Sees Typhoon Malakas Starting To Batter Japan
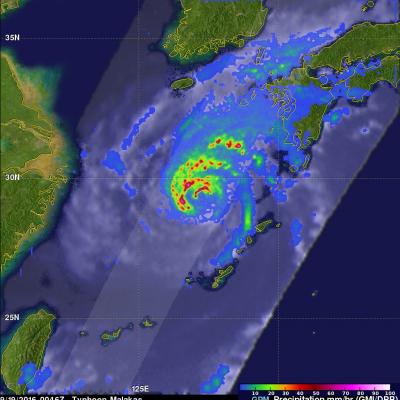
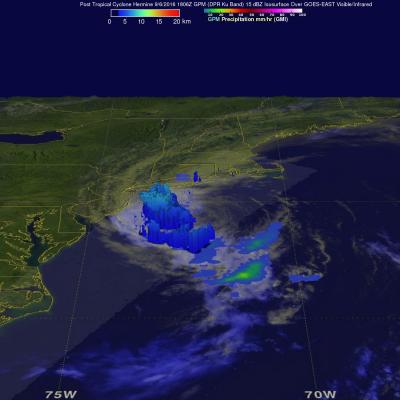
September 19, 2016 0046 UTC September 19, 2016 1031 UTC After causing high winds and heavy rainfall over northern Taiwan, typhoon Malakas is now starting to batter the islands of southern Japan. The GPM core observatory satellite passed above typhoon Malakas twice on September 19, 2016. The first time was at 0046 UTC when the typhoon was starting to cause light to moderate rainfall over the island of Kyushu. At 1031 UTC GPM showed that moderate to heavy rainfall was moving over Kyushu and the typhoon's appearance had changed significantly. The change in appearance was credited to increased