Gaston Hovers Around Hurricane Intensity as it Moves into the Central Atlantic
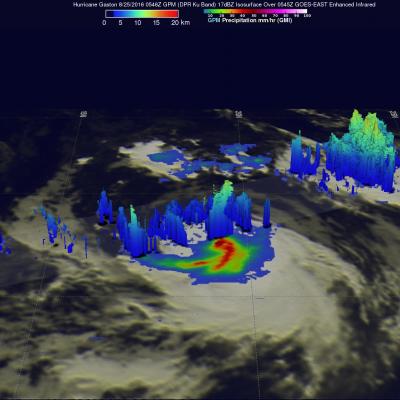
Gaston became the 3rd hurricane of the season early this morning (just after midnight EDT) as the storm was moving northwestward into the Central Atlantic about midway between the Leeward Islands and the Cape Verde Islands before weakening back into a tropical storm less than 12 hours later. Gaston is continuing to battle relatively strong environmental wind shear brought about by an upper-level low pressure center positioned to the west of Gaston. Winds flowing counter-clockwise around the upper low are blowing from the southwest while Gaston is moving northwest. These opposing winds are