Tropical Storm Darby Brings Occasionally Heavy Rain To The Hawaiian Islands
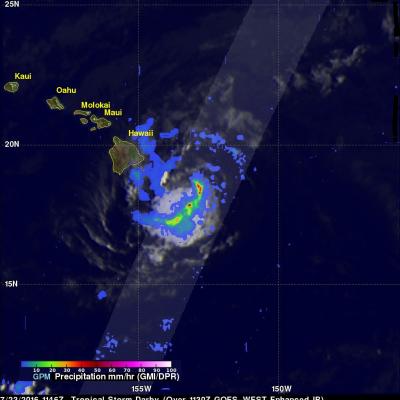
Tropical storm Darby has caused some heavy rainfall in the Hawaiian Islands since hitting the big island (Hawaii) on Saturday July 23, 2016. After hitting the big island Darby passed to the south of Molokai and Maui. Rain falling at a rate of 25.4 mm (1 inch) to 50.8 mm (2 inches) per hour was reported on the island of Oahu as Darby passed to the southwest of the island. The National Weather Service office in Honolulu reported that parts of Interstate H-1 that serves the southern side of Oahu was closed due to flooding on Sunday night. Darby is affecting northern Kaui today. The GPM core