GPM Sees Tropical Depression SIX-E Forming
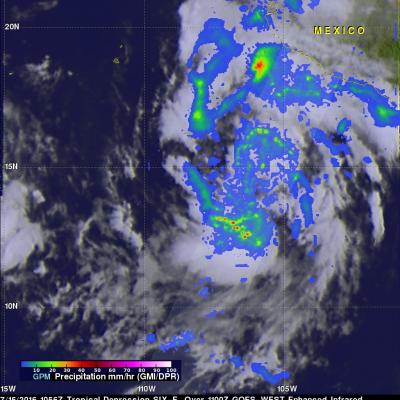
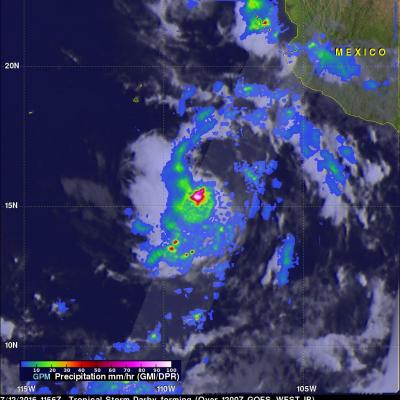
A large area of low pressure in the eastern Pacific Ocean was sufficiently organized and developed that the National Hurricane Center (NHC) designated it as tropical depression SIX-E on July 15, 2016 at 1500Z (9:00 AM MDT). With the development of tropical depression SIX-E there are currently three active tropical systems in the eastern Pacific Ocean. The GPM core observatory had a good view of forming tropical depression SIX-E when it flew over on July 15, 2016 at 1056 UTC (4:56 AM MDT). Precipitation data were calculated from data collected by GPM's Microwave Imager (GMI) and Dual-Frequency