TRMM Sees Weakening Hurricane Kenneth
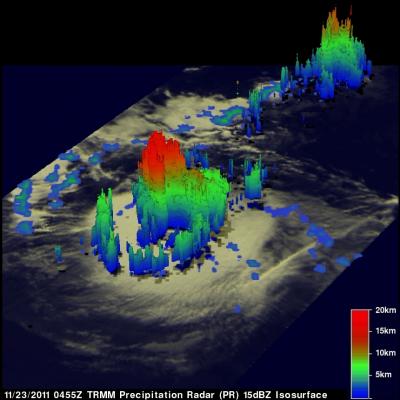
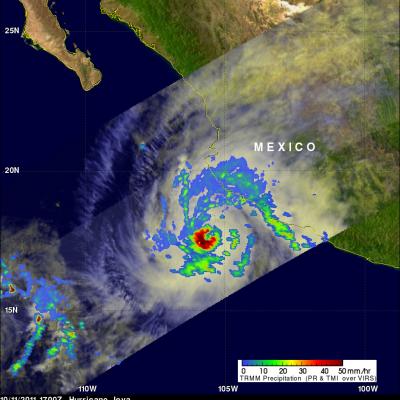
Hurricane Kenneth (in the eastern Pacific Ocean) reached powerful category four hurricane strength with wind speeds of 125 kts (~144 mph) on Tuesday 22 November 2011. The TRMM satellite passed directly above Kenneth as it was rapidly weakening on Wednesday 23 November 2011 at 0455 UTC. A rainfall analysis from TRMM's Micrwave Imager (TMI) and Precipitation Radar (PR) instruments is shown overlaid on an infrared image from TRMM's Visible and InfraRed Scanner (VIRS). Very heavy rainfall of over 50mm/hr (~2 inches) is shown by this analysis occurring in the northeastern side of Kenneth's eye wall