
IMERG

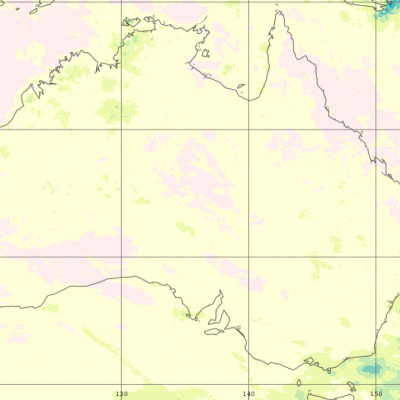
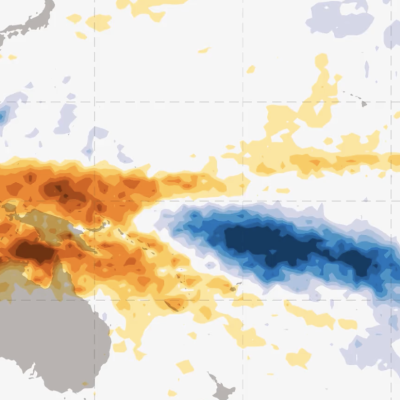
MJO Phase 1 precipitation anomaly from IMERG
Whether or not it rains a week from now where you live may seem mostly random, but a long enough data record will likely reveal rainfall patterns that repeat over hours, months, or years. Atmospheric scientists describe some of these repeating patterns as cycles and others as oscillations. There are annual and daily precipitation cycles tied to the variation of the sun's path across the sky [1]. An example of precipitation affected by time of day is that summer thunderstorms occur predominantly in afternoon or early evening along the East Coast of the United States. An example of seasonal
IMERG Precipitation Anomaly for Day of Year 1 to 30
In many places, the amount of that rain falls on a particular day or hour is influenced by multiple natural cycles that exist simultaneously on different time scales. One such cycle repeats every 24 hours, and another repeats every year. The global extent of these cycles can be studied using NASA's IMERG precipitation estimates that have been generated for 1998 to the present. Most of Earth's precipitation falls as rain, and the rest falls as snow, hail, or other forms of precipitation. The length of IMERG's data record makes it possible to average out some of the random error and unrelated
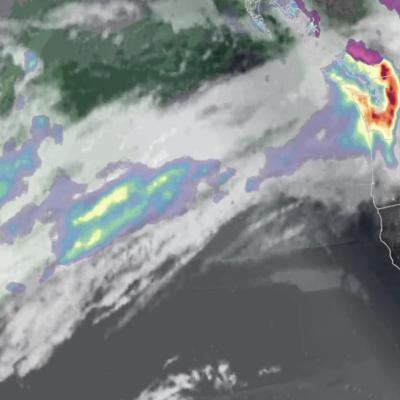
IMERG view of an atmospheric river impacting Washington State on December 9, 2025
Several atmosphere rivers have recently carried plumes of moisture from the Tropics toward the United States. These plumes of water vapor have contributed to flood-producing storms over Washington State during the first three weeks of December 2025.
Date Last Updated
August 8th, 2025
Document Description

The Integrated Multi-satellitE Retrievals for the Global Precipitation Measurement (GPM) mission (IMERG) combines precipitation retrievals from all available low-orbit passive microwave (PMW) data, together with geosynchronous infrared (GEO-IR) providing baseline retrievals to compute merged global precipitation every half hour. The IMERG Early Run includes forward propagation of PMW data, while the Late Run also uses backward propagation. IMERG includes the Defense Meteorological Satellite Program (DMSP) Special Sensor Microwave Imager/Sounder (SSMIS) constellation operated by the U.S.

File Downloads
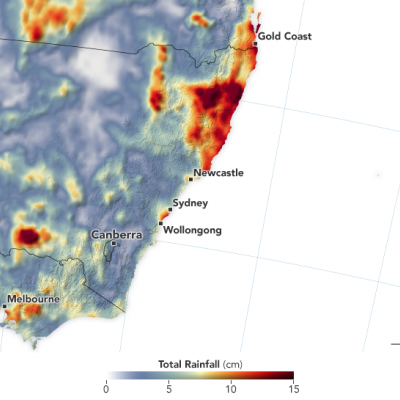
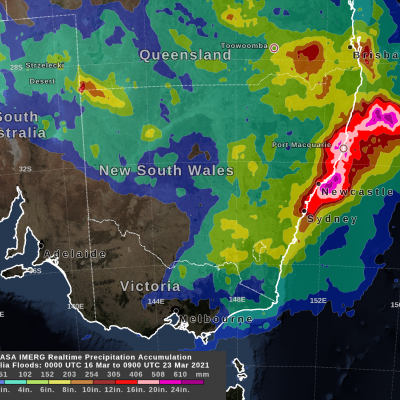
IMERG Precipitation Totals from Eastern Australia, March 16 - 23, 2021
During the week ending on March 23, 2021, two locations in Australia experienced unusually high rainfall totals. According to news reports a persistent system brought flooding rains to Australia's east coast from Brisbane to Sydney and points further south. The preliminary estimate from NASA's multi-satellite global precipitation analysis is that more than 24 inches fell just off the coast of Australia in 7 days with accumulations in coastal areas exceeding 16 inches. Near the Strzelecki Desert in central Australia, a storm system brought 8 inches of precipitation during the same 7-day period. Most of the rain fell during a 3-day period (0000 UTC on 20 March to 2359 UTC on 22 March).
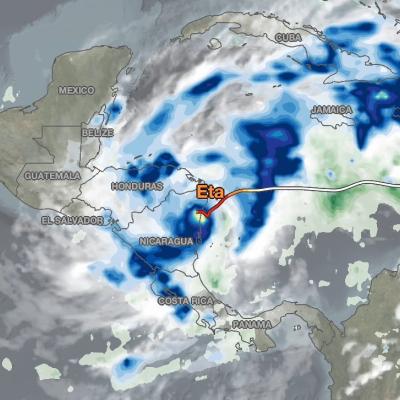
Hurricane Eta IMERG Screenshot
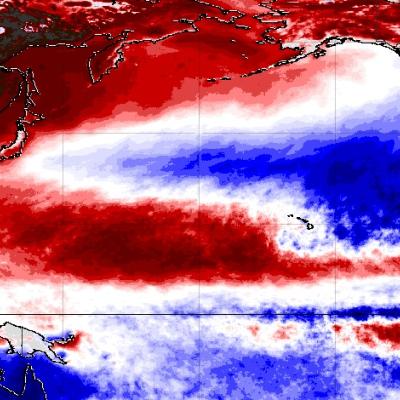
The extremely active 2020 Atlantic hurricane season, aided by the ongoing La Niña, continues on. After Hurricane Zeta made landfall along the northern part of the Gulf Coast, yet another hurricane has arisen - Hurricane Eta, the strongest of the season. Like Zeta, Eta also formed in the Caribbean, where sea surface temperatures are still running quite warm at around 29° C, almost a full degree above average and well above the typical 26° C needed for tropical cyclone development. But while Zeta turned north into the Gulf of Mexico, Eta moved westward where it delivered powerful winds and

GPM IMERG Observes Rainfall from Tornado-spawning Storms in the Southern U.S.
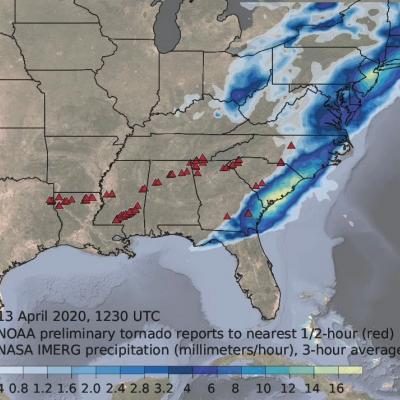
Download video (right-click -> Save As). Credit: Jason West (KBR / NASA GSFC) From Sunday, April 12th, 2020 into Monday the 13th, a series of powerful thunderstorms developed across the southern U.S., bringing heavy rainfall and spawning several destructive tornadoes. This animation shows rainfall estimates for the region for April 11th - 13th derived from NASA's Integrated Multi-satellite Retrievals for GPM (IMERG) data product, along with NOAA tornado reports (red triangles).
Map of Earth Showing the GPM Grand Average Climatology.
IMERG rainfall totals from Australia in November 2019
Droughts and dry, arid conditions are naturally occurring phenomena in Australia. Such an environment is conducive to wild fires, which are started mainly by lightning and can occur throughout the year, but typically emerge between October and April and are most prevalent during the Southern Hemisphere summer; they are part of the seasonal cycle in Australia. However, some years are worse than others, and the 2019-2020 wild fire season was especially bad. It has been estimated that upwards of 46 million acres were burned, or roughly the size of the entire state of Washington. In terms of area...
Rain Brought Brief Relief to Australia
For much of the 2019-2020 austral summer, plumes of bushfire smoke have billowed from southeastern Australia in such large amounts that the ground was barely visible in satellite images. In mid-January, some of those plumes were finally quelled by a few days of much-needed rainfall.