tropical storms

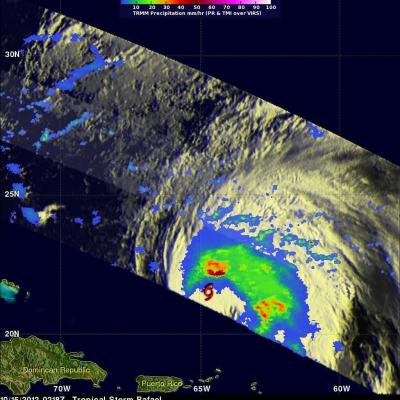
TRMM Views Of Tropical Storm Andrea

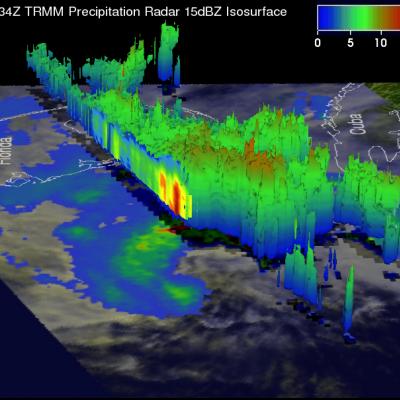
The TRMM satellite satellite flew directly above tropical storm Andrea on Wednesday June 5, 2013 at 2234 UTC (6:34 PM EDT) and received data used in the image on the left. These data were captured just over an hour after the National Hurricane Center (NHC) named tropical storm Andrea. A rainfall analysis from TRMM's Microwave Imager (TMI) and Precipitation Radar (PR) instruments shows that moderate to heavy rain was wrapping around the eastern side of the storm. The heaviest rainfall of 124.5 mm/hr (~4.9 inches) from TRMM PR data was found on Andrea's southeast side. TRMM had another fairly

Zane Heading Towards Queensland Australia

Cyclone Zane, which as of 12:00 UTC (10:00 pm Australian Eastern Standard Time or AEST) 1 May 2013, was located about 215 km (~133 miles) due east of the coast of Queensland, Australia. TRMM captured this recent image of Cyclone Zane at 11:48 UTC (9:48 pm AEST) 1 May 2013. At the time, the center of circulation was located about 215 km (~133 miles) due east of the coast of Queensland, Australia and was heading west-northwest. TRMM reveals that Zane is still not very well organized with no eye visible and very little evidence of banding (curvature) in the rain area. At the time of this image

Freda Brings Heavy Rains to New Caledonia

After forming just south of the Solomon Islands on the evening of December 28th (local time), Cyclone Freda moved southward and intensified, becoming a strong Category 3 cyclone on the 30th. As the storm continued to move south, it weakened significantly and approached the island of New Caledonia on the 2nd of January 2013 as a tropical storm. TRMM captured this image of Freda at 07:16 UTC (6:16 pm local time) 2 January 2013. The image shows an instantaneous snap shot of the rain intensities within Freda. Rain intensities in the center of the swath are from the TRMM Precipitation Radar (PR)

Tropical Storm Haruna Headed For Madagascar

The TRMM satellite had a good look at a tropical storm called Haruna forming in the Mozambique Channel on February 18, 2013 at 1541 UTC. Haruna was called a tropical storm early today and TRMM had another fairly good view when it flew above at 0811 UTC. Haruna is predicted to intensify to a strong tropical storm with wind speeds of about 50kts (~58 mph) and cross southern Madagascar in a couple days. TRMM's Microwave Imager (TMI) and Precipitation Radar (PR) rainfall data were used in the two rainfall analyses shown. TRMM PR showed that very intense rain was falling at a rate of over 134 mm/hr

Tropical Storm Haruna Intensifying

The TRMM satellite flew above intensifying tropical storm Haruna in the Mozambique Channel again on February 20, 2013 at 0717 UTC. A rainfall analysis using data from TRMM's Microwave Imager (TMI) and Precipitation Radar (PR) instruments is shown overlaid on a combination visible/infrared image from the Visible and InfraRed Scanner (VIRS). TRMM showed that Haruna had become much better organized than yesterday with intense bands of rainfall circling the tropical cyclone's center of circulation. Some rain in powerful storms on the northern edge of Haruna's center was found by TRMM PR to be

Deadly Tropical Cyclone Haruna Departs Madagascar

Tropical cyclone Haruna has battered southwestern Madagascar with hurricane force winds and flooding rainfall for the past two days. The city of Morombe was heavily damaged and Haruna was reported to have killed six people. The TRMM satellite passed over Haruna yesterday on February 22, 2013 at 1336 UTC when the tropical cyclone was over southwestern Madagascar. TRMM passed almost directly above weakening tropical storm Haruna again today on February 23, 2013 at 0608 UTC. Haruna weakened from category one hurricane force yesterday to tropical storm force today. Today TRMM's Microwave Imager

Tropical Cyclone Rusty Heading For Australia

A tropical cyclone called Rusty developed in the Indian Ocean north of north-western Australia's coast on February 24, 2013. The TRMM satellite viewed the intensifying tropical cyclone when it flew over on February 25, 2013 at 0750 UTC. A rainfall analysis from TRMM's Microwave Imager (TMI) and Precipitation Radar (PR) with that orbit is shown overlaid on a visible/infrared image from TRMM's Visible and InfraRed Scanner (VIRS). This analysis showed that Rusty had an extensive area of rainfall surrounding Rusty's very large eye. TRMM PR and TMI instruments found that rain within wide bands of

Powerful Rusty At Australia's Door

Tropical cyclone Rusty's winds had increased to hurricane intensity when the TRMM satellite flew directly above on February 26, 2013 at 0654 UTC. A rainfall analysis derived from TRMM data is shown with the first image. Rain rates in the center of the swath are from the TRMM PR, while those in the outer swath are from the TRMM Microwave Imager (TMI). The rain rates are overlaid on a combination infrared (IR) visible (vis) image derived from the TRMM Visible Infrared Scanner (VIRS). TRMM PR found that the heaviest surface rain was coming down at a rate of over 138mm/hr (~5.4 inches). This

TRMM Sees Tropical Storm Bofa

The TRMM satellite flew above tropical storm Bofa on November 27, 2012 at 1601 UTC and collected data used in the image above. TRMM showed that tropical storm Bofa had an area of very intense convective storms near the center of circulation. TRMM's Microwave Imager (TMI) and Precipitation Radar (PR) data revealed that rain was falling at a rate of over 70mm/hr (~1.75 inches) in that area. TRMM's Precipitation Radar (PR) also showed that powerful storms in the area of the developing eye wall were reaching to heights of about 17km (~10.6 miles). Click here to see a simulated flyby above Bofa

Tropical Storm Rafael Getting Stronger

Tropical Storm Rafael Getting Stronger A low pressure center in the eastern Caribbean Sea became tropical storm Rafael on Friday October 12, 2012. The tropical storm wasn't very well organized until today but the National Hurricane Center (NHC) predicts that Rafael will become a hurricane this evening. The TRMM satellite saw most of Rafael on October 15, 2012 at 0218 UTC (10:18 PM EDT October 14) and collected data used in the rainfall analysis on the right.