Images and caption by Hal Pierce (SSAI/NASA GSFC)

Peru's Deadly Rainfall Examined With NASA's GPM Data

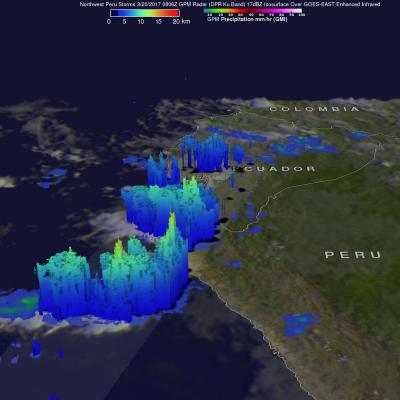
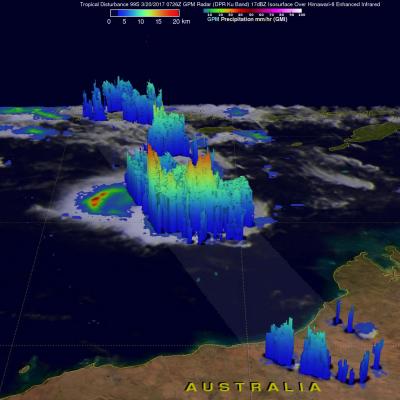
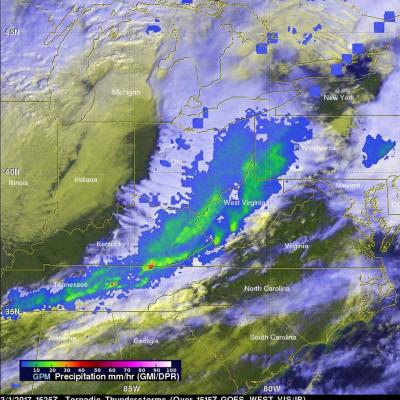
This year unusually heavy rainfall has caused extensive flooding and loss of life in Peru. Extreme flooding and frequent landslides that occurred this month have forced many from their homes. An El Niño like condition with warm ocean waters developed near Peru's coast. This extremely warm water off Peru's western coast has been blamed for promoting the development of these storms. Equatorial sea surface temperatures (SSTs) are about average elsewhere in the central and east central Pacific. This image shows the locations of storms that were dropping heavy rainfall over northwestern Peru when

GPM Sees Powerful Convective Storms In The Timor Sea

The GPM core observatory satellite passed above some energetic storms in the Timor Sea north of Australia on March 20, 2017 at 0726 UTC. These powerful storms were being invigorated by very warm sea surface temperatures and low vertical wind shear aloft. Balmy water in the Timor Sea was reaching temperatures of 30 to 32 degrees Celcius (86 to 89.6 Fahrenheit). Data collected by GPM's Microwave Imager (GMI) and Dual-Frequency Precipitation Radar (DPR) instruments showed that these storms contained some very heavy downpours. GPM's DPR found rain falling at a rate of over 238 mm (9.4 inches) per

Tropical Cyclone's Remnants Examined By GPM

The GPM core observatory satellite flew above the remnants of tropical cyclone 11S on March 14, 2017 at 2356 UTC. The remnants were located south-southeast of Madagasgar and were rapidly transforming into an extra-tropical low. GPM showed the locations of intense rainfall still being produced by the low. GPM's Dual-Frequency Precipitation Radar (DPR) data showed that rain was falling at a rate of over 205 mm (8 inches) in a few storms. GPM's radar (DPR Ku Band) found that some storm tops in the remnants were reaching heights above 13 km (8 miles). GPM satellite radar (DPR Ku Band) data were

Tropical Cyclone Enawo's Rainfall Totals Updated With IMERG

Tropical cyclone Enawo is now responsible for the deaths of at least five people in Madagascar. Many thousands of people were also displaced due to flooding and destroyed homes. The tropical cyclone dropped heavy rainfall as it soaked the island from north to south. This rainfall analysis was updated to include recent precipitation estimates from NASA's Integrated Multi-satelliE Retrievals for GPM (IMERG) rainfall data. It shows rainfall estimates from IMERG data collected during the period from March 3-10, 2017. As expected, the eastern side of Madagascar had the highest rainfall total

Deadly Tropical Cyclone Enawo Drenches Madagascar

Tropical cyclone Enawo hit Madagascar on Tuesday with powerful winds and drenching rain. At least three people have been reported killed by the tropical cyclone. Floods and landslides are likely as Enawo moves southward down the center of Madagascar. Tropical cyclones rotate in a clockwise direction in the southern hemisphere so the eastern side of Madagascar will have a strong onshore flow. The extreme amount of moisture flowing onto Madagascar from the Indian Ocean is expected to produce flooding and landslides. NASA's Integrated Multi-satelliE Retrievals for GPM (IMERG) data are produced

NASA Examines Deadly Spring-Like Weather With GPM Satellite

Rainfall from spring-like downpours in the U.S. from February 25 to March 1 were analyzed at NASA using data from the Global Precipitation Measurement mission or GPM satellite. This GPM rainfall image combined with infrared cloud data from NOAA's GOES-West satellite shows the line of storms that stretched from Pennsylvania to Alabama on March 1, 2017. Red areas indicate rainfall up to 50 mm per hour. Record breaking warm temperatures this winter have caused plants to bloom early in the eastern United States. Unfortunately this has also resulted in the formation of spring-like severe

Powerful Tropical Cyclone Enawo Threatens Madagascar

Tropical cyclone Enawo has continued to intensify while moving toward Madagascar. Enawo had winds of about 90 kts (103.5 mph) when the GPM core observatory satellite flew over on March 6, 2017 at 0306 UTC (0606 AM local time). These powerful winds make Enawo the equivalent of a category two hurricane on the Saffir-Simpson Hurricane wind scale. GPM revealed that the tropical cyclone had heavy rainfall in distinct feeder bands on the western side and in the northeastern side of the eyewall. Precipitation was measured by GPM's DPR falling at a rate of over 220 mm (8.7 inches) per hour in intense

GPM Examines Deadly Tropical Cyclone Dineo

Dineo has now weakened to a tropical depression but the tropical cyclone had winds of over 70 kts (80.5 mph) when it hit Mozambique. Four people have been reported killed by Dineo. The GPM core observatory satellite flew over Mozambique on February 16, 2016 at 0916 UTC after Dineo's maximum sustained winds had fallen to about 60 kts (69 mph). Data collected by GPM's Microwave Imager (GMI) and Dual-Frequency Precipitation Radar (DPR) instruments showed that the tropical cyclone was still dropping light to moderate rainfall over a large area of southern Mozambique. This GPM view revealed that

Intensifying Tropical Cyclone Dineo Seen By GPM

Tropical cyclone Dineo was intensifying in the middle of the Mozambique Channel when the GPM core observatory satellite flew over on February 14, 2017 at 0926 UTC. Dineo had winds of about 55 kts (~ 63.3 mph) at the time of this GPM pass. Very heavy precipitation was found in feeder bands on Dineo's northeastern side. The most intense rainfall was measured by GPM's Dual-Frequency Precipitation Radar (DPR) falling at a rate of over 132 mm (5.2 inches) per hour in the intense storms in the northeastern quadrant of the tropical cyclone. GPM's radar (DPR Ku Band) sliced through the center of

GPM Satellite Reveals Intensity Of Powerful Storms In The Timor Sea

The GPM satellite flew over a stormy area of the Timor Sea northwest of Australia on February 7, 2017 at 1926Z. GPM found that this stormy area contained some extremely powerful convective storms. GPM's Dual-Frequency Precipitation Radar (DPR) found that the most intense storms were dropping rain at a rate of over 268 mm (10.6 inches) per hour. Data received by GPM's Radar (DPR Ku Band) also revealed the 3-D anatomy of precipitation hidden inside these unusually powerful storms. GPM's radar found that these storm tops were pushing to altitudes greater than 19 km (11.8 miles). GPM radar data