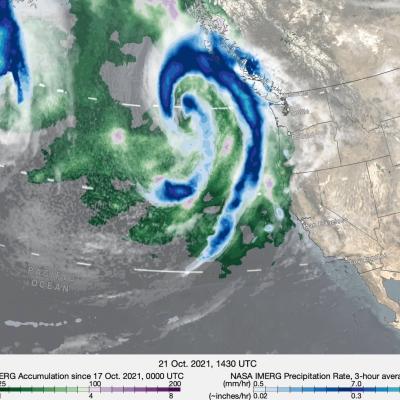
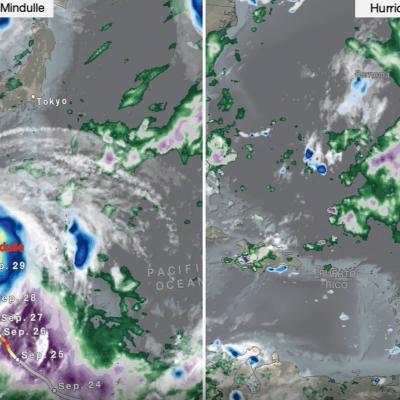
Extreme Weather News

Jump to a Year

2024 | 2023 | 2022 | 2021 | 2020

2019 | 2018 | 2017 | 2016 | 2015

2014 | 2013 | 2012 | 2011 | 2010

2009 | 2008 | 2007 | 2006 | 2005

2004 | 2003 | 2002

IMERG precipitation over China for July 17 to 28, 2021
During July 17 to 28, 2021, several storm systems brought heavy rain to parts of China and surrounding countries, while a nine-month-long drought persists in an adjacent part of China. NASA's multi-satellite precipitation algorithm has been monitoring this rainfall in near real-time, and the estimates are distributed to weather-forecasting agencies and disaster-monitoring organizations. This algorithm is called IMERG, the Integrated Multi-satellitE Retrievals for GPM. GPM is the NASA / JAXA Global Precipitation Measurement mission, which launched its Core Observatory satellite in 2014. Two
IMERG analysis of monsoon rainfall in India, July 2021
After a relatively quiet period of below normal activity that began in the latter part of June and extended into the first half of July, and which resulted in rainfall deficits over much of India, the South Asian monsoon surged to life last week, bringing heavy rains, widespread flooding and landslides. Among the hardest hit areas was the western state of Maharashtra, which extends from the central west coast of India inland. A key geographical feature along the west coast of India is the Western Ghats. This coastal mountain range runs roughly north-south for about 1000 miles along the west
Arizona GPM DPR Convective Storm 3D View 2021 July 15
There is a monsoon that occurs in the southwestern U.S. each summer, and it brought heavy rain to the deserts of Arizona this week. This monsoon is less well known than India's Summer Monsoon, but both monsoons have similar causes [1, 2, 3]. In western Mexico and the southern edge of the southwest U.S., most of the year's rain typically falls in just three months: June, July, and August. The region is shown in light blue in the below climate map, which shows where summer rainfall predominates (Figure 1). This seasonal pattern is known as the North American Monsoon. The map was generated using
IMERG Rainfall Totals from Cyclone Tauktae
NASA combined data from multiple satellites in the GPM Constellation to estimate precipitation rates and totals from Tropical Cyclone Tauktae in May 2021. The below animation shows precipitation rates (blue/yellow shading) and accumulations (green shading) at half-hourly intervals from May 12-19, 2021, derived from NASA's IMERG algorithm. Underneath the precipitation data, cloud cover is shown in shades of white/gray based on geosynchronous satellite infrared observations. On top of the precipitation data, the cyclone's approximate track is displayed based on estimates from the Joint Typhoon
IMERG Precipitation Totals from Eastern Australia, March 16 - 23, 2021
During the week ending on March 23, 2021, two locations in Australia experienced unusually high rainfall totals. According to news reports a persistent system brought flooding rains to Australia's east coast from Brisbane to Sydney and points further south. The preliminary estimate from NASA's multi-satellite global precipitation analysis is that more than 24 inches fell just off the coast of Australia in 7 days with accumulations in coastal areas exceeding 16 inches. Near the Strzelecki Desert in central Australia, a storm system brought 8 inches of precipitation during the same 7-day period. Most of the rain fell during a 3-day period (0000 UTC on 20 March to 2359 UTC on 22 March).