IMERG Measures Flooding Rainfall In Northwest England
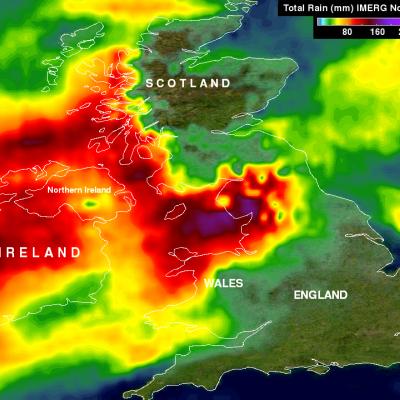
In addition to destructive winds measured at 81 mph (70 kts) a powerful winter storm called Desmond dropped record rainfall in northwest England over the past weekend. Desmond's unusually heavy rainfall resulted in wide spread damaging floods. Data from NASA's Integrated Multi-satellitE Retrievals for GPM (IMERG) were used to estimate rainfall for the period from November 30 to December 7, 2015. This analysis found that some rainfall near the Irish Sea measured over 392 mm (~15.4 inches) during this period. As much as 304 mm (~12 inches) of rain were reported to have fallen in only 24 hours