GPM Catches Tropical Cyclone Ula Rebounding
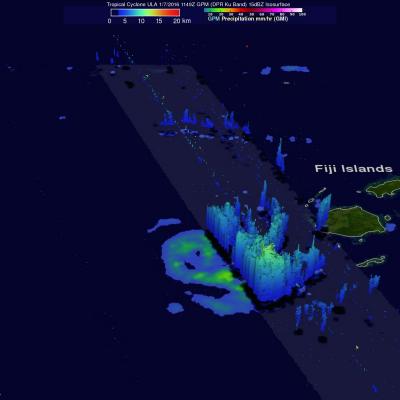
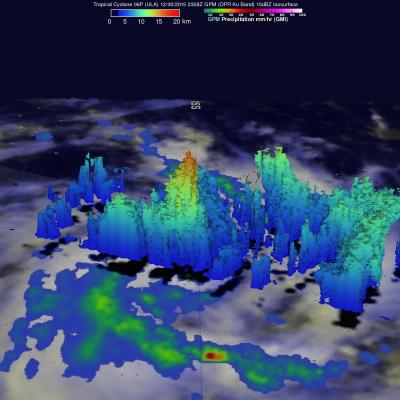
Tropical cyclone ULA weakened to tropical storm intensity after passing south of and then to the west of the Fiji Islands in the South Pacific. ULA has now started to intensify again while moving to the southeast of New Caledonia. The GPM core observatory satellite passed above tropical cyclone ULA on January 7, 2016 at 1149 UTC when maximum sustained wind speeds were estimated at 45 kts (52 mph). Rain was measured by GPM's Dual-Frequency Precipitation Radar (DPR) instrument falling at a rate of 68 mm (2.7 inches) per hour in storms on ULA's southern side. Some of these convective storms were