GPM Observes Hot Tower in Florida Squall Line
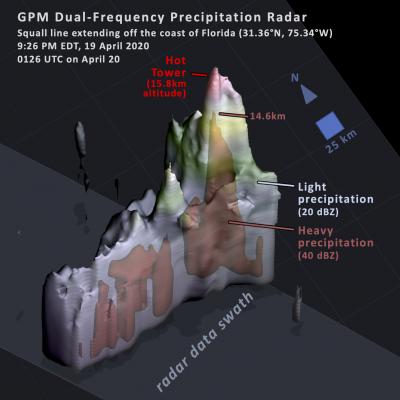
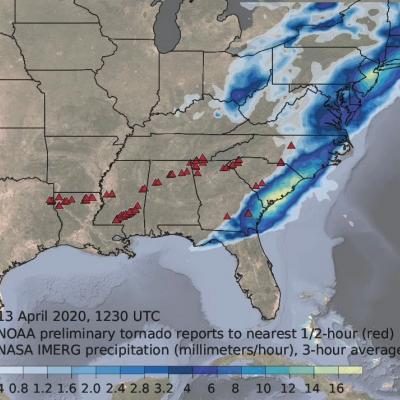
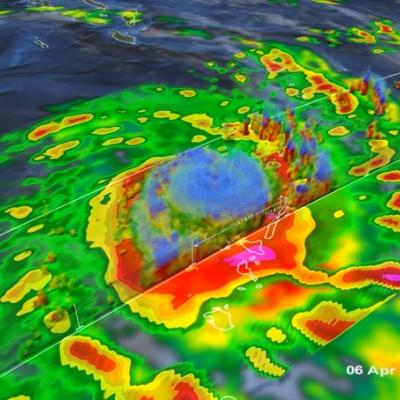
At 9:26pm on Sunday April 19, 2020, NASA's GPM satellite observed an extremely vigorous convective storm cell embedded within a squall line that had produced tornadoes earlier that evening along the US Gulf Coast. NASA's GPM satellite flew over the portion of this squall line that extended over the Atlantic Ocean, 350 miles (500 kilometers) east of Florida's Coast. The Dual-Frequency Precipitation Radar (DPR) observed a storm cell whose updrafts were strong enough to lift small ice particles into the stratosphere 15.8 km above the ocean surface. Equally remarkable is that the updrafts were