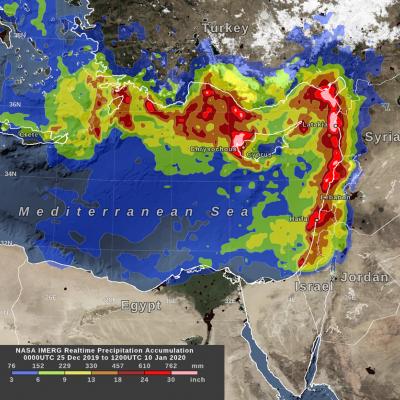
GPM Measures Heavy Rainfall from "The Dragon" Cyclonic Storm System in the Middle East
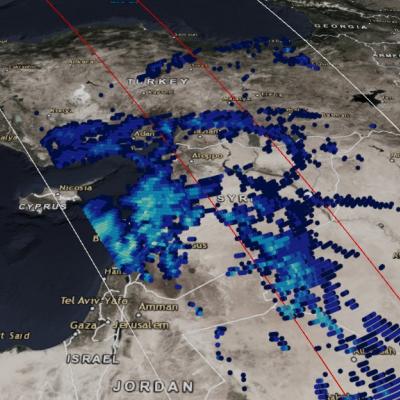
GPM observed the early stages of a strong cyclonic system that developed over northern Africa just off the southern Mediterranean coast on March 11, 2020. The GMI measured heavy rain rates over some parts of Egypt, including the region around Cairo. View fullscreen By March 12, 2020, the cyclonic system that developed over northern Africa had intensified and was nicknamed 'The Dragon' on social media and news outlets, as it caused severe flooding in northern Egypt. Both the GMI and the DPR measured heavy rain rates across two of the storm's bands in this GPM overflight. View fullscreen On