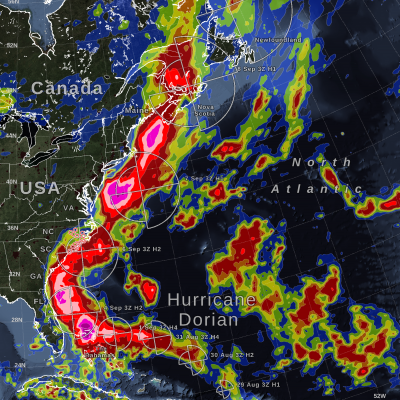
GPM IMERG Measures Rainfall Accumulation from Hurricane Dorian in the Caribbean
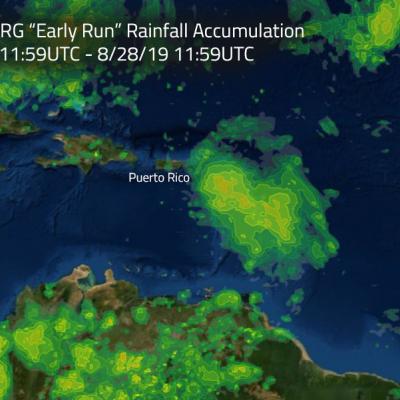
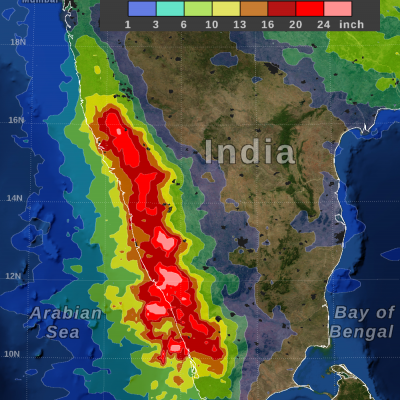
Hurricane Dorian is packing heavy rain as it moves toward the Bahamas as predicted by NOAA’s NHC or National Hurricane Center. NASA's GPM mission recently analyzed the storm and found heavy rainfall in the storm as it passed through the Caribbean. This image shows estimated rainfall accumulations for the region affected by Hurricane Dorian over the 24 hour period of Aug.27 11:59 UTC to Aug. 28 11:59 UTC. The imagery was generated using the Integrated Multi-satEllite Retrievals for GPM (IMERG) “early run” product. The data indicates that up to 120 mm (4.72 inches) of rainfall accumulated in