Tropical Cyclone Nora's Flooding Rains Measured With IMERG
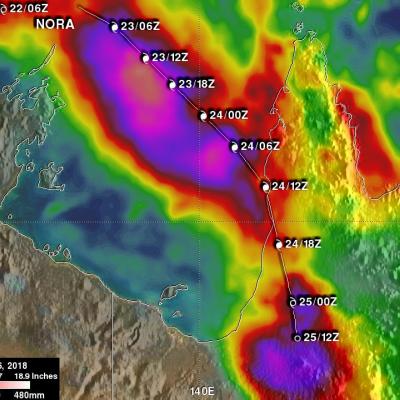
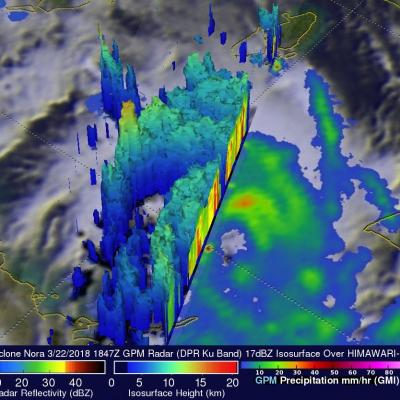
Tropical Cyclone NORA produced heavy rainfall when it came ashore in northwestern Queensland on March 24, 2018 (GMT). NORA's peak intensity of 95 kts (109 mph) was reached when the tropical cyclone was located in the central northern Gulf Of Carpentaria. Winds had decreased slightly to 90 kts (104 mph) by landfall. The Australian Bureau of Meteorology (BOM) reported that NORA produced over 110 mm (4.3 inches) of rain in 24 hours. Flooding, landslides, lost electrical power, and structural damage were also a companion of the tropical cyclone's arrival. After landfall NORA weakened but the