GPM Sees Tropical Cyclone Fakir Forming Near Madagascar
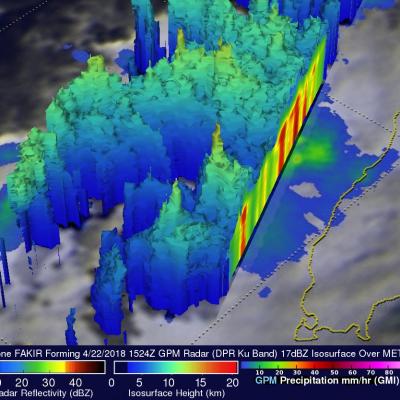
The southwest Indian Ocean cyclone season started on November 15, 2017 and will officially end on April 30, 2018. A tropical cyclone labeled FAKIR by Meteo France formed today near northeastern Madagascar. FAKIR is expected to intensify as it moves toward the southeast and could be a significant tropical cyclone tomorrow. This cyclone season has already seen Madagascar battered and drenched by tropical cyclones Ava, Dumazile, and Eliakim. The GPM core observatory satellite flew above the forming late season tropical cyclone near northeastern Madagascar on April 22, 2018. The satellite's