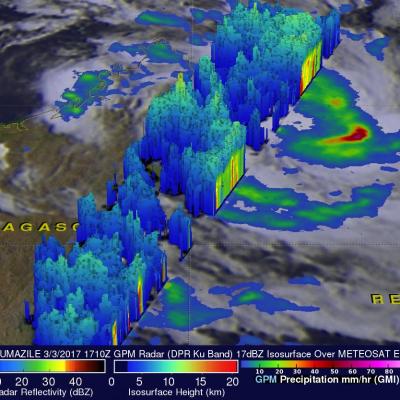
Forming Tropical Cyclone Near Madagascar Inspected By GPM
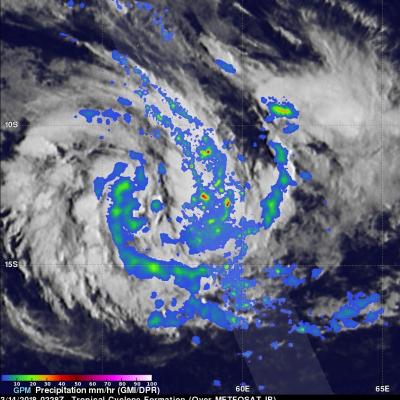
A new tropical cyclone may affect Madagascar in a few days. The Joint Typhoon Warning Center (JTWC) has been keeping an eye on an area of convection in the Indian Ocean northeast of Madagascar. A circulation center has already been observed. Environmental conditions are favorable for the birth of a tropical cyclone in that area with the presence of low vertical wind shear and warm sea surface temperatures. Tropical cyclone AVA caused many deaths in January when it's heavy rains caused extensive flooding in Madagascar. Tropical cyclone DUMAZILE also caused extensive flooding less than two weeks