Tropical Cyclone Ava's Disastrous Rainfall Measured With IMERG
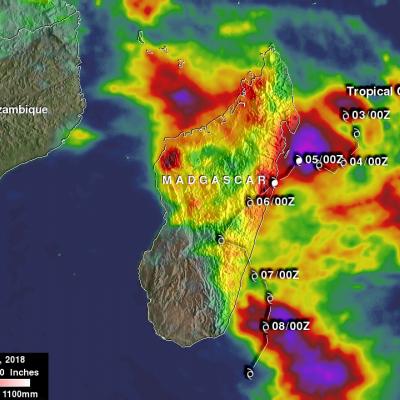
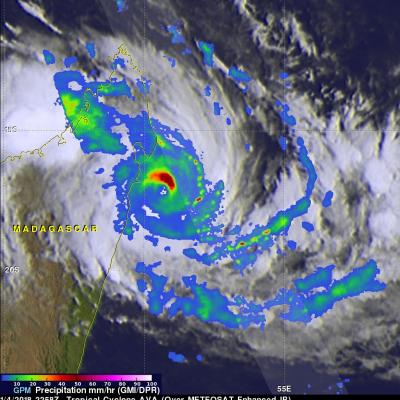
Tropical cyclone Ava dropped extremely heavy rainfall over Madagascar as it passed over the eastern side of the island country from January 5-6, 2018. Ava's drenching rainfall caused flooding and landslides which resulted in the deaths of at least 29 people. An estimated 80,000 people on Madagascar were affected by the tropical cyclone. This rainfall analysis was produced by accumulating rainfall that fell near Madagascar during the period from January 2-8, 2018. These IMERG estimates showed the locations of extreme rainfall totals during the period when tropical cyclone Ava was in Madagascar