GPM Views Potential Australian Tropical Cyclone
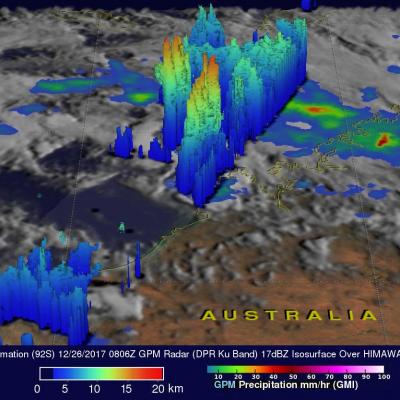
On December 26, 2017 at 0806 UTC The GPM core observatory satellite satellite flew above northwestern Australia. GPM traveled over an area of convective thunderstorms in the Indian Ocean north of Australia's coast where a tropical cyclone is expected to develop. GPM's Microwave Imager (GMI) and Dual-Frequency Precipitation Radar (DPR) instruments collected data that showed heavy precipitation in storms off the Australian coast. GPM's radar (DPR Ku Band) showed that a few extremely powerful convective storms northwest of the Dampier Land coast were dropping precipitation at a rate of greater