GPM Views Sheared Tropical Cyclone Fehi
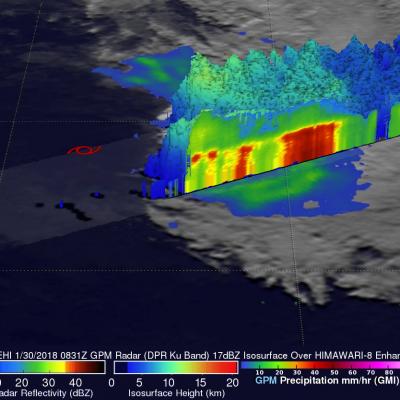
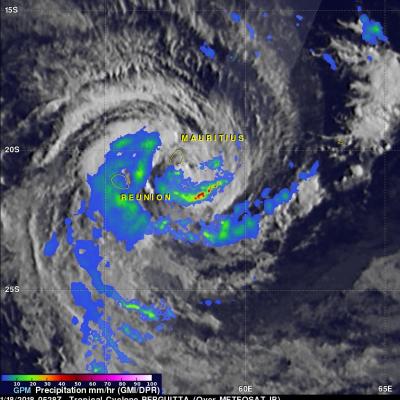
The GPM core observatory satellite flew tropical cyclone FEHI on January 30, 2018 at 0831 UTC. GPM revealed that precipitation was only located around the southern side of FEHI's circulation. Strong vertical wind shear had caused the surface center of circulation (shown with a red symbol) to be displaced well to the north of the heaviest rainfall. The satellite found that some convective storms on the southern side of the tropical cyclone were still producing very heavy precipitation. GPM's Microwave Imager (GMI) and Dual Frequency Precipitation Radar (DPR) instruments revealed rainfall in a