GPM Observes Tropical Cyclone Dahlia In Southwest Indian Ocean
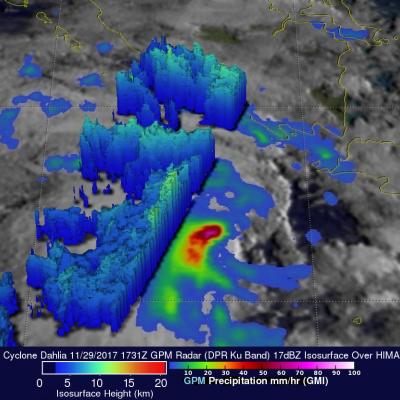
Yesterday tropical Cyclone Dahlia became the first tropical cyclone of the 2017-2018 Southwest Indian Ocean season. Today, Dahlia was moving toward the southeast and was passing to the south of the Indonesian islands of Java and Sumatra with wind speeds of about 35 kts (40.3 mph). Tropical cyclone Dahlia was passing over the warm ocean waters (28-29 degrees Celsius) of the Indian Ocean. On November 29, 2017 at 1731 UTC NASA's GPM Core Observatory satellite passed above forming tropical cyclone Dahlia. Data collected by GPM's Microwave Imager (GMI) and Dual-Frequency Precipitation Radar (DPR)