Intensifying Typhoon Damrey Threatens Vietnam
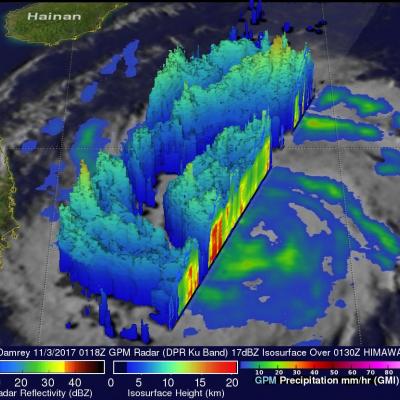
Typhoon Damrey has been increasing in intensity since forming in the South China sea west of the Philippines on November 1, 2017. Damrey has moved westward through the South China Sea and is now threatening southern Vietnam. The GPM core observatory satellite passed above Damrey on November 3, 2017 at 0118 UTC when the typhoon's winds had reached about 65 kts (75 mph). The satellite's Microwave Imager (GMI) and Dual Frequency Precipitation Radar (DPR) instruments collected data showing the locations of rainfall within the typhoon. Damrey's center of circulation was evident but the typhoon didn