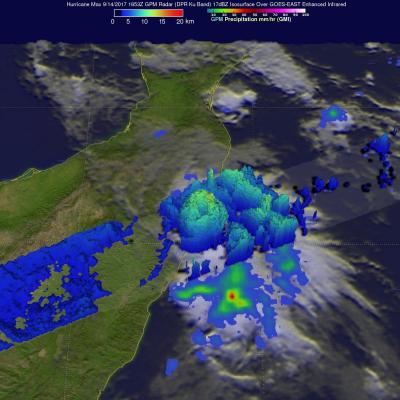
Hurricane Maria Threatening The Leeward Islands
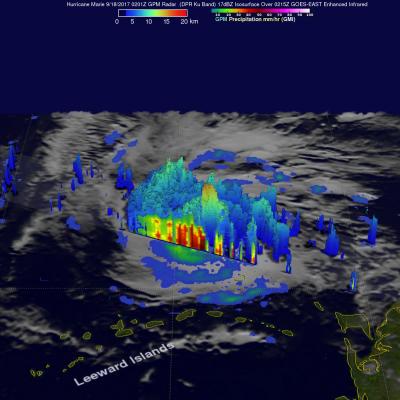
Intensifying hurricane Marie is on a path that is predicted to impact the Leeward Islands. Hurricane Irma caused death and wide spread destruction there less than two weeks ago. Very powerful convective storms and multiple lightning strokes within Maria have been cited as proof that Maria is an energetic intensifying hurricane. The GPM core observatory satellite had an excellent view of hurricane Maria when it passed almost directly above the hurricane on September 17, 2017 at 1001 PM AST (September 18, 2017 0201 UTC). GPM's Microwave Imager (GMI) and Dual-Frequency Precipitation Radar (DPR)