GPM Sees Typhoon Talim Threatening Islands Of Japan
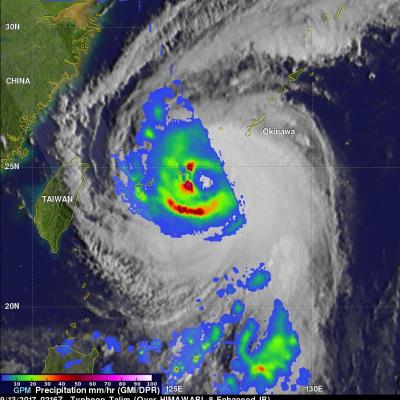
The Joint Typhoon Warning Center (JTWC) predicts that typhoon Kalim in the western Pacific Ocean will intensify and threaten the islands of southern Japan in the the new three days. Environmental conditions such as low vertical wind shear and warm sea surface temperatures are favorable for Talim's intensification. Talim's winds are expected to increase to a peak of 115 kts as it re-curves toward the the Japanese island of Kyushu. The GPM core observatory satellite scanned the western side of typhoon Talim on September 13, 2017 at 0216 UTC. GPM's Microwave Imager (GMI) instrument collected data