GPM's Radar Measures Intense Rain In Hurricane Harvey
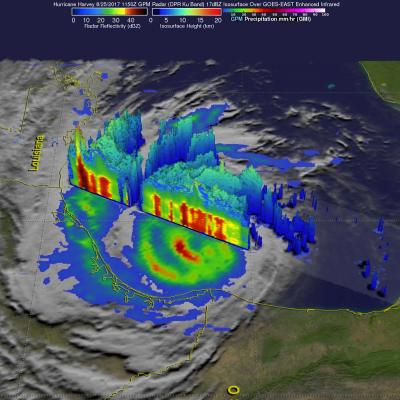
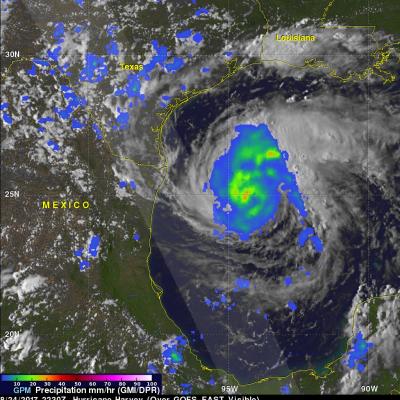
Hurricane Harvey's has continued to intensify today as it moves toward the Texas coast. Bands of rain from the hurricane were affecting the Gulf coast from Louisiana to southeastern Texas. The Global Precipitation Measurement (GPM) mission core observatory satellite had another look at hurricane Harvey on August 25, at 7:50 AM CDT (1150 UTC) as it was menacing the Texas gulf coast. GPM's Dual-Frequency Precipitation Radar (DPR) instrument scanned precipitation within powerful storms wrapping around the eastern side of the hurricane. DPR found that intense storms in that area were dropping rain