Logo for GPM Applications showing ecology, water and agriculture, energy, disasters, health, and weather.

Applications


Image

Overview

The Global Precipitation Measurement (GPM) mission has several cross-cutting application areas which contribute to and enhance our understanding of weather forecasting, disasters, ecology, health, water and agriculture and energy. Using advanced space-borne instruments, GPM measures light rain to heavy rain and falling snow, producing a near-global view of precipitation every 30 minutes. Through improved measurements of rain and snow, precipitation data from the GPM mission is used by a diverse range of applications and user communities at local to global scales to inform decision making and policy that directly benefits society. 

Sections

What are Applications? 

“Applications” refers to the use of mission data products in decision-making activities for societal benefit. Mission Applications take a satellite's data products and expands them into areas where they can help inform policy or decisions. 

Learn more about Applied Sciences at NASA

Who's Using GPM Data?

Learn about the different people and organizations that are using GPM and other NASA Earth data to help improve life around the world. 

View Articles

2022 GPM Mentorship Program


GPM Data for Decision Making

Are you using GPM satellite precipitation data in your work, or would you like to? Share your story with our team, or ask us any questions you may have using our contact form.

We also encourage you to get involved in GPM applications by attending an applications event or accessing the free and publicly available data in the data section of this site

  • Dalia Kirschbaum (NASA GSFC), GPM Mission Associate Deputy Project Scientist for Applications
  • Andrea Portier (NASA GSFC / SSAI), GPM Applications and Outreach Coordinator
  • Dorian Janney (NASA GSFC / ADNET), GPM Outreach Specialist
  • Jacob Reed (NASA GSFC / Telophase), GPM Web Developer

Applications Featured Resources

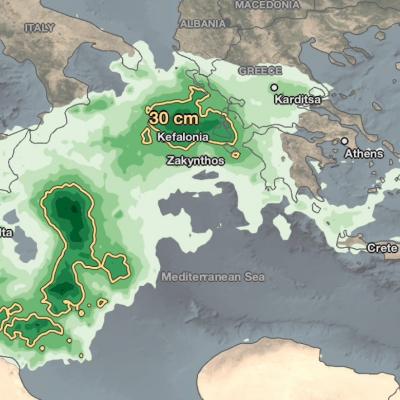
IMERG rainfall totals from Japan, July 3 - 9 2020
From July 3-9, 2020, NASA’s IMERG algorithm continued to observe the heavy precipitation that fell as part of the seasonal Meiyu-Baiu rains (“plum rains”) in east Asia. Weekly totals reached their regional maxima over the island of Kyushu in southern Japan. About half of the island of Kyushu received over 45 cm (~18 inches) of rain. The majority of Honshu, Japan’s main island, as well as Shikoku to its south, were also impacted by the rains, receiving from 10-25 cm, depending on the location. Additionally, large areas of eastern China were also covered by the plum rains during this weekly
IMERG rainfall totals from Japan, June 29 - July 5, 2020
This animation shows NASA IMERG rain rates (blue shading) and accumulations (green shading) near Kyushu island, in the southwest of Japan from June 29 - July 5, 2020. Devastating floods and landslides swept through parts of Kyushu on July 4, 2020, resulting in over 40 deaths and orders for hundreds of thousands of people to evacuate their homes according to media reports. Download video (right-click -> Save As) The rains that triggered the flooding occurred in the context of the Meiyu-Baiu rainy season, which arrives in east Asia every year from June to mid-July. “Meiyu” and “Baiu” are the
Farmer in a field in El Salvador
To reduce risks from natural disasters and build climate resilience, decision makers are using NASA Earth observations to develop index-based insurance products and protect low-income customers in Central America, especially in the region known as the Dry Corridor.
Hurricane Forecasting Screenshot
The powerful hurricane that struck Galveston, Texas on September 8, 1900, killing an estimated 8,000 people and destroying more than 3,600 buildings, took the coastal city by surprise. This video looks at advances in hurricane forecasting in the 120 years since, with a focus on the contributions from weather satellites. This satellite technology has allowed us to track hurricanes – their location, movement and intensity. “One of the dramatic impacts is that satellite data keeps an eye on the target," especially over unpopulated areas such as oceans, said JPSS Director Greg Mandt. “We’re sort...
Andrea Portier
Meet Andrea Portier. By day, Portier is an application and outreach coordinator for the Global Precipitation Measurement Mission (GPM). By night — well, when she’s not at work — Portier can be found exploring local national parks and taking community classes. Portier spends her time honing her communication skills to help user communities understand GPM data and apply it to the real-world issues they face. We chatted with Portier to learn how she communicates complex ideas to diverse audiences, why her other career choice would be a wilderness therapy guide, and what advice she would give to...
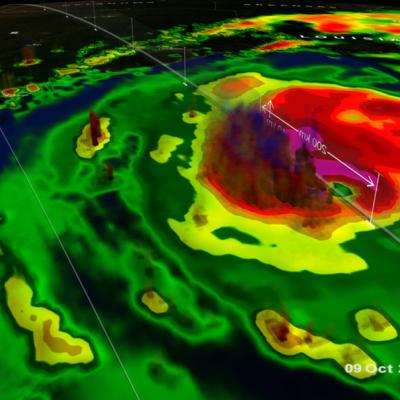
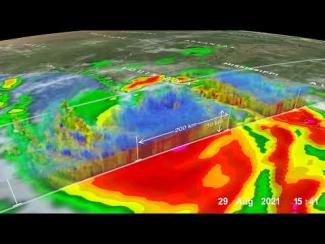
GPM Overpass of Hurricane Dorian
Tropical cyclones, known as hurricanes in the western hemisphere, can bring damaging high winds, storm surge, and flooding rainfall to the coastal communities they hit. Satellite instruments - and the detailed near real-time atmospheric data that they provide - have revolutionized the way we see hurricanes and other disasters as they happen. But it’s about more than just seeing. NASA, working with counterparts at NOAA, FEMA, and elsewhere are sharing ever more precise data to aid local communities in coping with disasters. With better information, emergency responders have the tools to make...
Cyclone Amphan IMERG Rainfall Totals
On May 16, 2020, NASA / JAXA's GPM Core Observatory satellite observed the early stages of Tropical Cyclone Amphan as it tracked north over the Bay of Bengal. The below GPM overpass shows precipitation within Cyclone Amphan a day before it explosively intensified into a category 4-equivalent cyclone. Even at this early stage, Amphan produced heavy rain rates near its center and to its west and southwest. View fullscreen in STORM Event Viewer NASA monitored the heavy rain associated with Tropical Cyclone Amphan as it made landfall at 0900 UTC (2:30 PM local time) on May 20, 2020. Landfall...
Typhoon Vongfong IMERG Rainfall Totals
The first typhoon of the season, Vongfong, struck the central Philippines this past week (where it is known as Ambo) as a strong category 2 storm, bringing strong winds and locally heavy rainfall. Vongfong formed into a tropical depression in the southern Philippine Sea west of Palau on Sunday May 10th from a disturbance that had been slowly making its way westward over the past several days. After becoming a depression, the system moved northward toward the central Philippine Sea and slowly began to intensify. Then, on the 12th when it reached tropical storm intensity, Vongfong’s northward...
GPM Earth Day 2020 Banner
On April 22, 2020, people around the world will celebrate the 50th anniversary of Earth Day, embracing our commitment towards understanding the planet’s environmental processes and protecting it for future generations. In support of this global event, NASA is highlighting the agency’s contributions to the environment with a week of online events, stories, and resources.
Farmers looking at an App
Unexpected shocks from natural hazards can affect populations throughout the globe, threatening sustainable development and resilience. However, the impacts of these events, such as extreme precipitation or drought, disproportionately affect the developing world where individuals often are not insured and live and work in conditions that leave them vulnerable to natural disasters. This can lead to significant economic and environmental challenges if preventive measures or mitigating measures are not taken in time. To reduce risks from natural disasters and build climate resilience, decision...

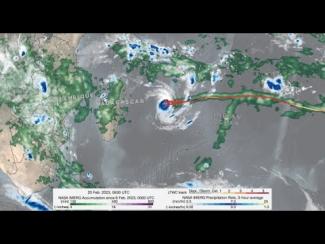
GPM IMERG precipitation rates and totals from Tropical Cyclone Freddy, Feb. 6 - March 12, 2023. Credit: NASA 

Download in high resolution from the NASA Goddard Scientific Visualization Studio

In a series of three half-day virtual meetings, this workshop will focus on current applications and future opportunities of NASA precipitation and cloud data products to support transport and logistical activities for aviation, maritime, roads and highway transportation systems. The workshop will bring together representatives from federal and state operational agencies and private companies to discuss how NASA precipitation and cloud products could be better leveraged to inform decision-making for transport and logistical operations. The workshop will also provide an opportunity for end...

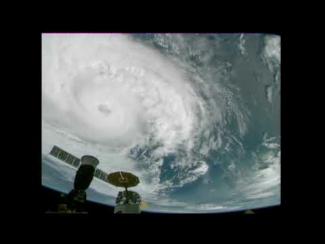
Cameras outside the International Space Station captured dramatic views of Hurricane Zeta at 12:50 pm ET October 28, as it churned 200 miles south-southwest of New Orleans packing winds of 90 miles an hour. Credit: NASA International Space Station

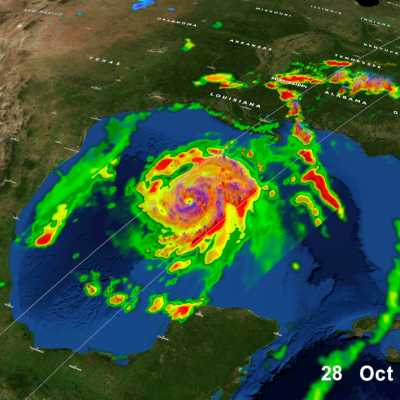
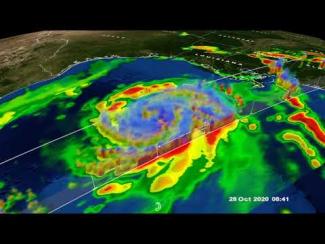
GPM Core Observatory overpass of Tropical Storm Zeta on October 28 at approximately 3:25am CDT (8:25 UTC). Credit: NASA Goddard Scientific Visualization Studio

View an interactive 3D visualization of this overpass in STORM Event Viewer

Hide Body

Hide Date

Hide Main Image

Hide Title