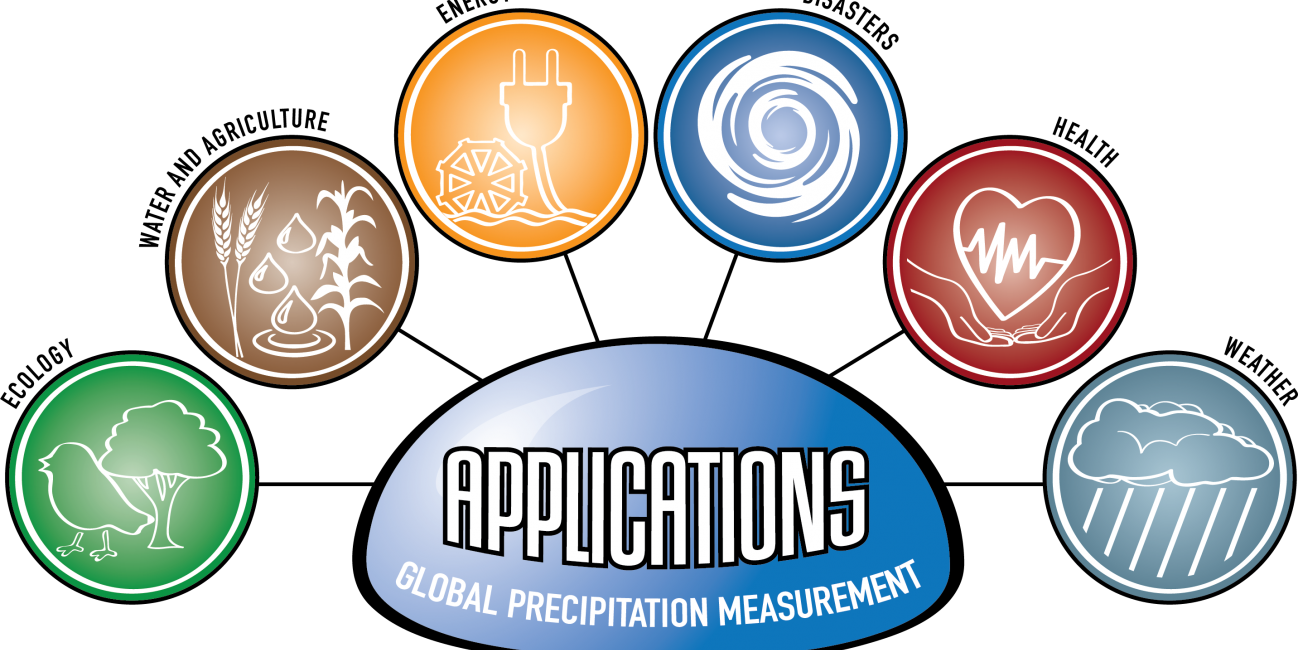
Logo for GPM Applications showing ecology, water and agriculture, energy, disasters, health, and weather.

Applications


Image

Overview

The Global Precipitation Measurement (GPM) mission has several cross-cutting application areas which contribute to and enhance our understanding of weather forecasting, disasters, ecology, health, water and agriculture and energy. Using advanced space-borne instruments, GPM measures light rain to heavy rain and falling snow, producing a near-global view of precipitation every 30 minutes. Through improved measurements of rain and snow, precipitation data from the GPM mission is used by a diverse range of applications and user communities at local to global scales to inform decision making and policy that directly benefits society. 

Sections

What are Applications? 

“Applications” refers to the use of mission data products in decision-making activities for societal benefit. Mission Applications take a satellite's data products and expands them into areas where they can help inform policy or decisions. 

Learn more about Applied Sciences at NASA

Who's Using GPM Data?

Learn about the different people and organizations that are using GPM and other NASA Earth data to help improve life around the world. 

View Articles

2022 GPM Mentorship Program


GPM Data for Decision Making

Are you using GPM satellite precipitation data in your work, or would you like to? Share your story with our team, or ask us any questions you may have using our contact form.

We also encourage you to get involved in GPM applications by attending an applications event or accessing the free and publicly available data in the data section of this site

  • Dalia Kirschbaum (NASA GSFC), GPM Mission Associate Deputy Project Scientist for Applications
  • Andrea Portier (NASA GSFC / SSAI), GPM Applications and Outreach Coordinator
  • Dorian Janney (NASA GSFC / ADNET), GPM Outreach Specialist
  • Jacob Reed (NASA GSFC / Telophase), GPM Web Developer

Applications Featured Resources

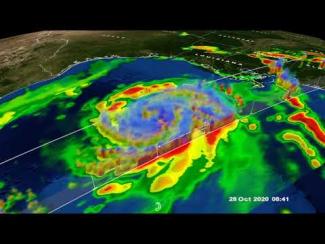
GPM Overpass of Hurricane Zeta on 10/28/20
As Hurricane Zeta moves towards landfall on the U.S. Gulf Coast, NASA has eyes on the storm with an array of Earth-observing instruments and stands ready to aid affected communities with critical data and analysis. Zeta is following a path similar to Hurricane Delta, which after crossing the Yucatan Peninsula made its way across the Gulf of Mexico and struck the Louisiana coast as a Category 2 hurricane on October 9. If Zeta makes landfall as expected along the northern Gulf Coast, it will become the 7th named storm to do so in this record-breaking season, following Tropical Storm Cristobal
GPM overpass of Hurricane Delta
The 2020 Atlantic hurricane season will go down as one of the most active seasons on record, currently second only to the incredible 2005 season in terms of the number of named storms. The 2020 season is only the second time in recorded history (the other being 2005) that the Greek alphabet has been used because the number of named storms has exceeded the number of regular names on the list. Another interesting aspect of the 2020 season has been the number of storms that have struck the northern Gulf Coast. So it is no surprise that the latest storm, Hurricane Delta, would also find its way to
Alaska Rainfall 2019 and 2020
NASA's multi-satellite precipitation algorithm, known as IMERG , is a tool that can help us understand recent fluctuations in Alaska's wildfires. In the summer of 2020, wildfires burned fewer acres in Alaska than in any other year during the past 10 years. In contrast, wildfires burned a record number of acres in Alaska in the summer of 2019. The image below shows the locations of satellite-detected fires and precipitation during the last two weeks of June for both years. The above image shows IMERG rainfall totals overlaid with fire hot spot detections from the Visible Infrared Imaging
IMERG Rainfall Totals from Medicane Ianos
From September 14th - 20th, 2020, NASA’s IMERG algorithm estimated the rainfall from a Mediterranean cyclone with tropical-like characteristics, commonly known as a “Medicane”, which flooded parts of Greece. Medicanes typically appear once or twice a year and are similar to tropical storms in that both have a symmetric structure, a warm core, a clearly visible eye, and winds of at least tropical-storm strength. This particular storm system, dubbed "Ianos" by the National Observatory of Athens, led to media reports of flooding throughout the islands of Kefalonia and Zakynthos off the western
IMERG totals from hurricane sally
The northern Gulf Coast has seen its share of storms this busy hurricane season. At the end of August, then Tropical Storm Marco brought heavy rains to parts of the Florida Panhandle while western Louisiana took a direct hit from the much more powerful Category 4 Hurricane Laura. Now, just over 3 weeks since Laura made landfall, the northern Gulf Coast was struck again, this time by Hurricane Sally. Though not as powerful as Laura, the still rather strong Sally behaved more like Marco. But, while Marco was largely sheared apart with most of the rain well northeast of the center as it slowed
IMERG Rainfall from Typhoons Bavi, Maysak and Haishen
From August 22 through September 7, 2020, NASA’s IMERG algorithm estimated rainfall from three typhoons as they passed over the Pacific Ocean, Japan, and Korea. According to NOAA's records, this was the only time since records have been kept starting in 1945 that the Korean peninsula saw three landfalling typhoons in a single year, let alone in two weeks. Each of the three typhoons--Bavi, Maysak, and Haishen--reached the equivalent of “major hurricane” status, meaning Category 3 or above on the Saffir-Simpson hurricane-intensity scale (shown here as a red in the hurricane track) along their
IMERG rainfall from the Pakistan Floods 2020
In the last week of August 2020, Pakistan's largest city, Karachi, received over 8 inches of rainfall according to NASA's IMERG dataset, causing destructive flooding in the region. The amount of rain that fell that week is roughly equivalent to the amount that Karachi typically receives in an entire year, based on IMERG's 19-year global climatology. In a typical year, most of Karachi's rain will fall in July and August, but the rainfall during the week of August 23rd was unusually heavy. The top panel of the three panels in this image shows the depth of the 7-day rainfall accumulation in
IMERG Rainfall Totals from Hurricanes Marco and Laura
The northern Gulf Coast, specifically Louisiana, saw two tropical cyclones make landfall in the same week just days apart. The two systems, however, could not have been more different when they arrived. Despite forming a day later, Marco was the first system to make landfall on the Gulf Coast. Marco originated from a tropical easterly wave that was moving from the central to the western Caribbean. After becoming a tropical depression (TD) on the 20th of August, TD #14 turned northwestward the following day as it approached the coast of Central America and moved into the northwest Caribbean
GPM Overpass of Hurricane Laura 8/27/20
After crossing western Cuba, Tropical Storm Laura emerged into the Gulf of Mexico where warm water, low wind shear and a moist environment made conditions ideal for intensification. As it made its way through the Gulf of Mexico Laura strengthened - from a category 1 hurricane with sustained winds of 75 mph on the morning of Tuesday August 25th, to a powerful category 4 storm, with sustained winds of 150 mph on the evening of Wednesday August 26th - an increase of 75 mph in just 36 hours. At this point Laura was nearing the coast of western Louisiana, and made landfall near Cameron, Louisiana
GPM Overpass of Hurricane Laura 8/26/20 10:00pm CT
Hurricane Laura began as a tropical depression on August 21st near the U.S. Virgin Islands, and over the next several days rapidly intensified to a dangerous category 4 hurricane at it moved towards the U.S. Gulf Coast. Laura made landfall as strong category 4 hurricane near Cameron, Louisiana shortly after midnight on August 27, 2020, bringing extreme rainfall, storm surge, and winds up to 150 mph. The NASA / JAXA GPM Core Observatory satellite flew over Hurricane Laura shortly before it made landfall at 10:00pm CT on Wednesday, August 26th, then again at 7:42am CT on Thursday, August 27th

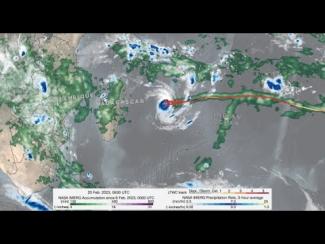
GPM IMERG precipitation rates and totals from Tropical Cyclone Freddy, Feb. 6 - March 12, 2023. Credit: NASA 

Download in high resolution from the NASA Goddard Scientific Visualization Studio

In a series of three half-day virtual meetings, this workshop will focus on current applications and future opportunities of NASA precipitation and cloud data products to support transport and logistical activities for aviation, maritime, roads and highway transportation systems. The workshop will bring together representatives from federal and state operational agencies and private companies to discuss how NASA precipitation and cloud products could be better leveraged to inform decision-making for transport and logistical operations. The workshop will also provide an opportunity for end...

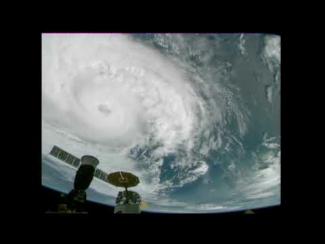
Cameras outside the International Space Station captured dramatic views of Hurricane Zeta at 12:50 pm ET October 28, as it churned 200 miles south-southwest of New Orleans packing winds of 90 miles an hour. Credit: NASA International Space Station

GPM Core Observatory overpass of Tropical Storm Zeta on October 28 at approximately 3:25am CDT (8:25 UTC). Credit: NASA Goddard Scientific Visualization Studio

View an interactive 3D visualization of this overpass in STORM Event Viewer

Hide Body

Hide Date

Hide Main Image

Hide Title