Hurricanes

GPM Passes Over Weakening Hurricane John

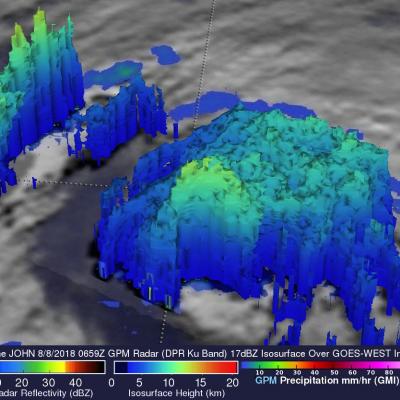
The GPM core observatory satellite provided very good coverage of hurricane JOHN when it passed above the eye of the tropical cyclone on August 8, 2018 at 0:59 AM MDT (0659 UTC). JOHN's maximum sustained wind speeds had started to decrease. GPM's Microwave Imager (GMI) and Dual-Frequency Precipitation Radar (DPR) instruments showed that most of JOHN's precipitation was then located in the eastern half of the hurricane. A large cloud free area had developed between the center of the hurricane and an intense feeder band wrapping around the northern and western side of the hurricane. GPM's radar

GPM Views Hurricane Fabio off the Coast of Mexico

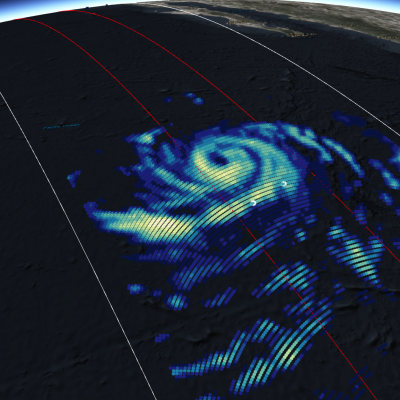
View fullscreen in STORM Event Viewer Off the southwest coast of Mexico, Hurricane Fabio has winds approaching 80 knots in this overflight, with a clear eye in the microwave and radar imagery. Fabio is expected to intensify over the next 24-48 hours, but will remain over open waters throughout its lifespan, eventually dissipating. Want to see other events in STORM Event Viewer? Have questions about the technology behind it? Contact the PPS Visualization Team The Dual-frequency Precipitation Radar and GPM Microwave Imager data are products of a joint mission between NASA and JAXA. If you are

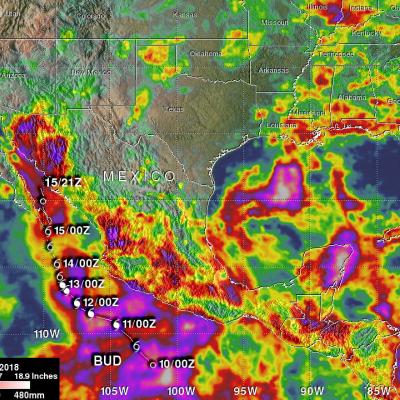
Hurricane Bud's Rainfall Measured with GPM IMERG

Beneficial rainfall from hurricane Bud's remnants has spread into the Desert Southwest. This rainfall may be helpful in an area that has been experiencing exceptional drought accompanied by wildfires. Bud's rainfall may also signal the beginning of the summer monsoon over the Desert Southwest. The image above shows estimates of accumulated rainfall using IMERG (Integrated Multi-satellitE Retrievals for GPM) data generated during the period from June 9-18, 2018. This rainfall occurred during the period when Bud formed southwest of Mexico, intensified into a powerful category four hurricane

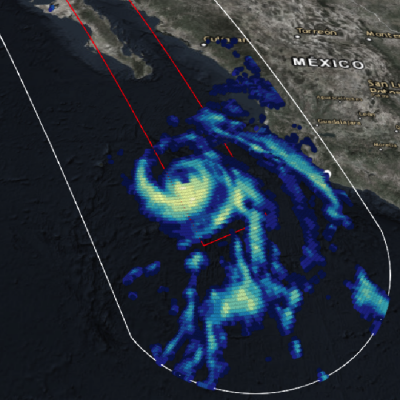
GPM Flies Over Hurricane Bud off the Coast of Mexico

View full-screen in STORM Event Viewer The GPM core observatory satellite passed above hurricane BUD in the eastern Pacific Ocean on June 12, 2018 at 5:27 PM MDT (2327 UTC). BUD's movement over colder waters had caused it's eye to become less defined. Data collected by GPM's Microwave Imager (GMI) showed that moderate to heavy precipitation was only present in the southeastern quadrant of the weakening hurricane. GPM's GMI also indicated that the heaviest rainfall in the area, of over 78 mm (3.1 inches) per hour, was occurring near Mexico's coastline well to the northeast of BUD's center of

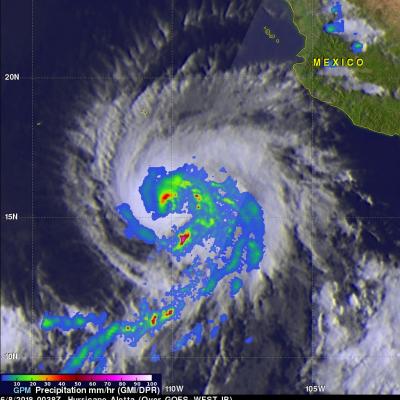
GPM Flies Over Intensifying Hurricane Aletta

As expected, tropical storm Aletta intensified and became a hurricane. Aletta was a powerful hurricane with winds of about 85 kts (98 mph) when the GPM core observatory satellite passed over head on June 7, 2018 at 18:38 PM MDT (June 8, 2018 at 0038 UTC). GPM's Microwave Imager (GMI) and Dual Frequency Precipitation Radar (DPR) instruments showed that hurricane Aletta contained powerful storms that were producing heavy precipitation. Very strong convective storms were producing heavy rainfall in Aletta's eye wall while the most extreme downpours were shown in a large feeder band wrapping

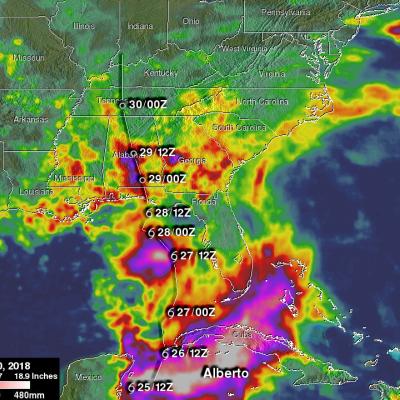
Alberto Makes Landfall, Brings Heavy Rains to Parts of the Southeast and Tennessee Valley

Alberto formed out of a broad area of low pressure at the surface that was located over and around the Yucatan Peninsula. Because the area of low pressure was under the influence of a nearby upper-level trough, Alberto was designated as a subtropical storm by the National Hurricane Center (NHC) on the morning of Friday May 25th, which is rather unusual as most subtropical storms form at higher latitudes. The storm initially formed just east of the Yucatan Peninsula. A large subtropical ridge over the southwestern Atlantic steered Alberto on a northward track, and the storm brushed the far

Powerful Hurricane Ophelia Seen Heading Toward Ireland

The GPM core observatory passed directly above hurricane Ophelia on October 14, 2017 at 1656 UTC. Ophelia was a powerful category three on the Saffir-Simpson hurricane wind scale with sustained winds of close to 115 mph (100 kts). GPM's Microwave Imager (GMI) and Dual-Frequency Precipitation Radar (DPR) instruments collected data showing the locations of extremely heavy rainfall with the hurricane. GPM's radar unveiled intense downpours in the northeastern side of Ophelia's eye that were dropping rain at the extreme rate of over 8.4 inches (213 mm) per hour. Other intense feeder bands with
GPM Catches Hurricane Nate's Landfall
NASA's GPM satellite helped track Nate's progress through the Gulf of Mexico and also captured Nate's landfall on the north central Gulf Coast. This animation shows instantaneous rainrate estimates from NASA's Integrated Multi-satellitE Retrievals for GPM or IMERG product over North America and the surrounding waters beginning on Thursday October 5th when Nate first became a tropical storm near the northeast coast of Nicaragua in the western Caribbean until its eventual landfall on the northern Gulf Coast on Sunday October 8th.

GPM Sees Powerful Thunderstorms In Landfalling Hurricane Nate

The GPM core observatory satellite passed above powerful thunderstorms within land falling hurricane Nate on October 8, 2017 at 4:41 AM EDT (0841 UTC). GPM's Dual-Frequency Precipitation Radar (DPR) found that a few storms over southwestern Alabama were dropping rain at the extreme rate of greater than 4 inches (102 mm) per hour. This 3-D slice by GPM's radar (DPR Ku Band) shows the structure of precipitation within the powerful thunderstorms near the center of hurricane Nate. A few thunderstorms over Alabama were found by GPM's radar to have tops reaching heights above 10.5 miles (17 km).