GPM

Content which is affiliated solely with the Global Precipitation Measurement Mission.

5 Years of Global Precipitation Measurement
Download this video in high resolution from the NASA Goddard Scientific Visualization Studio Five years ago, on Feb. 27, 2014, the Global Precipitation Measurement (GPM) Core Observatory, a joint satellite project by NASA and the Japan Aerospace Exploration Agency (JAXA), lifted off aboard a Japanese H-IIA rocket. Since then, the cutting-edge instruments on GPM have provided advanced measurements about the rain and snow particles within clouds, Earth’s precipitation patterns, extreme weather and myriad ways precipitation around the world affects society. Among the uses of GPM data are helping...
GPM Applications Logo
For the past 5 years GPM data has provided critical information to end-users to further our understanding of Earth's water cycle and to facilitate decision‐making at local and global scales. Building on the legacy of TRMM, the use of high‐quality precipitation data provided by GPM, with global coverage, has enabled new science research and data applications to benefit society across a diverse range of applications including water resource and ecological management, operational numerical weather prediction, disease prediction, and disaster modeling and response. Here are five highlights of the...
GPM flying over Earth with a data swath visualized.
Top 5 GPM engineering highlights placeholder.
Top 5 GPM Research Highlights
GPM celebrates its fifth anniversary since launching from Tanegashima Island, Japan on February 27, 2014. This milestone not only marks the launch but also the many scientific research accomplishments that GPM has made in advancing our understanding of precipitation, from light rain to intense thunderstorms, to further our understanding of the water cycle. Here are five of GPM’s most significant research accomplishments and their contributions to weather and climate science in its first five years in space: Snowfall and Cold Season Precipitation An image of GPM’s DPR concept of dual-frequency...

GPM Examines Weakening Tropical Cyclone Kenanga

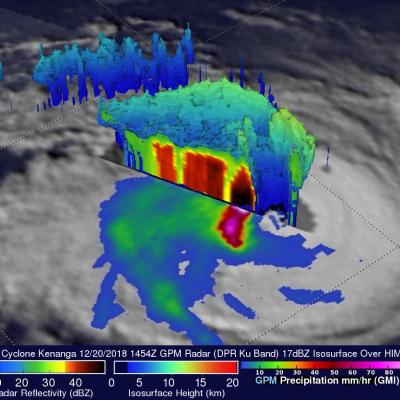
Tropical cyclone Kenanga has started to weaken as predicted. The GPM core observatory satellite had an excellent view of Kenanga on December 20, 2018 at 1454 UTC when the tropical cyclone's maximum sustained winds had decreased to about 90 kts (103.5 mph). That GPM pass also showed that the eye that was so prominent a day earlier had filled. Data collected by the satellite's Microwave Imager (GMI) and GPM's Dual-Frequency Precipitation Radar (DPR) instruments revealed through the overcast that powerful storms south of Kenanga's center of circulation were still producing very heavy rainfall

GPM IMERG Measures Hurricane Michaels Rainfall Accumulation

At least eleven deaths have now been attributed to deadly hurricane Micheal. Some casualties resulted not only from Micheal's destructive winds and storm surges but also from the blinding rain that Micheal produced as it battered states from Florida northeastward through Virginia. Today tropical storm Micheal is moving out over the Atlantic Ocean and has transitioned into a powerful extratropical storm. This animation using the GPM IMERG multi-satellite dataset shows the estimated total rainfall accumulation for #HurricaneMichael from 10/8/18 - 10/12/18. Learn more: https://t.co/aJuEp6o855 pic

IMERG Measures Flooding Rainfall In Deadly California Wildfire Areas

Heavy precipitation has been falling in areas of California that were recently devastated by deadly wildfires. This flooding rainfall has resulted in evacuations in burn scarred areas such as Butte County where the deadly Camp Fire hit this month. Flash floods, debris flows and mudslides are now predicted in areas where deadly wildfires stripped away vegetation. On a positive note these Pacific storms are expected to dampen wildfires and replenish the Sierra Nevada snowpack. This snowpack is an important source of water for California's streams and rivers. NASA's Integrated Multi-satellitE

NASA's IMERG Used To Analyze Tropical Storm Usagi's Rainfall

Usagi strengthened to hurricane intensity as it approached Vietnam from the South China Sea but weakened to tropical storm intensity when coming ashore. Very heavy rainfall and damaging winds accompanied tropical storm Usagi when it hit Vietnam's southern coast. More than 350 mm (14 inches) of rainfall was reported causing widespread flooding around Ho Chi Minh City. NASA's Integrated Multi-satellitE Retrievals for GPM (IMERG) data were used to show estimates of rainfall accumulation produced by Usagi as the tropical cyclone moved across the South China Sea into Southeast Asia. This IMERG

Tropical Cyclone Gaja's Rainfall Measured With IMERG

Tropical cyclone Gaja recently caused the deaths of at least 33 people in the southern India state of Tamil Nadu. Gaja's high wind and heavy rains caused landslides and building collapses. Gaja's maximum sustained winds had reached about 75kts (86 mph) when it hit southern India on Friday November 16, 2018. This meant that Gaja was the equivalent of a category one on the Saffir-Simpson hurricane wind scale. Today another tropical low is also moving over southern India and is expected to produce more heavy rainfall in the same area. NASA's Integrated Multi-satellitE Retrievals for GPM (IMERG)

Italy's Extreme Rainfall Examined With IMERG

During the past week a strong low-pressure system moving through southern Europe battered, drenched and flooded Italy. It caused flooding, landslides and other damage to large areas of the country. The deaths of at least 11 people have been attributed to this stormy weather. High winds knocked down many trees and heavy rainfall from these storms contributed to flooding in large areas of Italy. Venice was inundated when heavy rain fell and a surge of water from the Adriatic Sea was pushed into the city by the storm's very high winds. Data from various satellites, that cover most of the globe