TRMM

Content which is associated solely with the Tropical Rainfall Measuring Mission.

TRMM Sees Tropical storm Dorian Forming

The image on the left used data captured by the TRMM satellite on July 22, 2013 at 1703 UTC when it passed above a tropical wave in the eastern Atlantic Ocean. The tropical wave had moved from Africa into the eastern Atlantic earlier in the day. The TRMM satellite view on the right shows that the tropical wave's organization had greatly improved when data was again collected on July 23, 2013 at 0253 UTC. Analyses of rainfall from TRMM's Microwave Imager (TMI) and Precipitation Radar (PR) are shown overlaid on Visible and InfraRed Scanner (VIRS) data. A combination visible and infrared VIRS

TRMM Sees Strong Tropical Storm Cimaron

The TRMM satellite had another excellent view of tropical storm Cimaron near the coast of China on July 18, 2013 at 1804 UTC. This TRMM pass showed that Cimaron still contained some powerful thunderstorms. Some of these storms were found by TRMM's Precipitation Radar (PR) instrument to be dropping rain at a rate of over 141mm/hr (~5.6 inches). Some of this heavy rainfall was returning values of over 54dBZ to the satellite. Tropical storm Cimaron dissipated quickly after coming ashore but produced heavy rainfall that caused flooding in China's Fujian Province. This 3-D view from TRMM's

Tropical Storm Cimaron Brings Beneficial Rain To China

The image on the left used data captured by the TRMM satellite when it passed above tropical storm Cimaron on July 18, 2013 at 1132 UTC (~7:32 PM Local) just before it hit southeastern China. Rainfall was measured by TRMM's Microwave Imager (TMI) and Precipitation Radar (PR) instruments to be falling at a rate of over 183mm/hr (~7.2 inches) in a small area near Cimaron's center of circulation. TRMM PR found some radar reflectivity values greater than 55dBZ in these heavy rainshowers. Cimaron's track took it to the south of Taiwan yesterday. The rainfall anomaly analysis on the right was made

Weaker Typhoon Soulik Heads Towards Taiwan

TRMM satellite again flew above weakening typhoon Soulik on July 11, 2013 at 2119 UTC. Data from TRMM's Microwave Imager (TMI) and Precipitation Radar (PR) instruments show that Soulik had weakened considerably. The eye diameter was shown to be much greater than when TRMM passed over super typhoon Soulik about 7 hours earlier. This TRMM Precipitation Radar 3-D view (from the northwest) shows typhoon Soulik east of Taiwan. The structure of Soulik's large eye is clearly shown by this TRMM PR slice through the weakening typhoon. Soulik is predicted by the Joint Typhoon Warning Center (JTWC) to be

Super Typhoon Soulik Forms in the Pacific

Typhoon Soulik became the first super typhoon of the year when the Joint Typhoon Warning Center estimated that it's sustained winds had increased to 125 knots (~144 mph), which is equivalent to a Category 4 hurricane on the US Saffir-Simpson scale, at 00 UTC on the 10th of July. Soulik began as a tropical depression on the 8th (local time) about 120 miles (~195 km) east of the Northern Mariana Islands and quickly became a typhoon 24 hours later after moving westward into the Philippine Sea where it continued to intensify. TRMM captured this latest image of Soulik in the central Philippine Sea

Tropical Storm Chantal Enters the Eastern Caribbean

Since forming on the night (EDT) of 7 July 2013 in the tropical central Atlantic, Tropical Storm Chantal has continued to race westward at up to 29 mph (~46 kph) and has now entered the eastern Caribbean with sustained winds reported at 65 mph (~100 kph) by the National Hurricane Center. TRMM captured this latest image of Chantal at 02:37 UTC 9 July 2013 (10:37 pm EDT 8 July) as Chantal was approaching the Lesser Antilles. The image shows the horizontal distribution of rain intensity within Chantal. Rain rates in the center of the swath are from the TRMM Precipitation Radar (PR), and those in

Tropical Storm Chantal

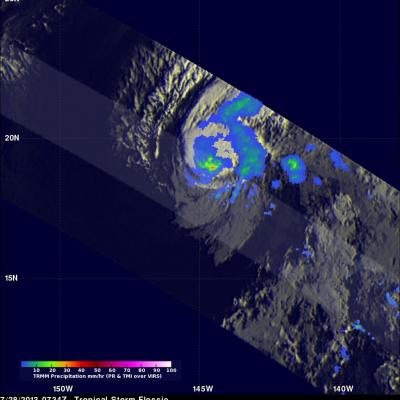
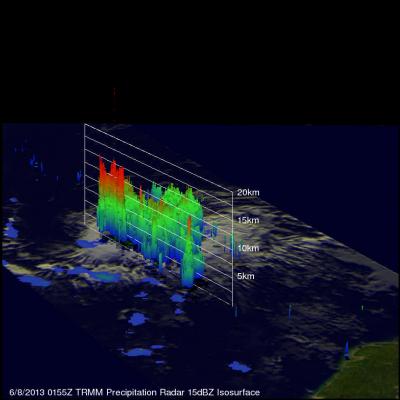
The TRMM satellite had a very good view of forming tropical storm Chantal, east-southeast of the Lesser Antilles, on July 8, 0155 UTC. TRMM Microwave (TMI) and Precipitation Radar (PR) rainfall data are shown overlaid on an enhanced infrared image from the Visible and InfraRed Scanner (VIRS). This analysis shows that the most intense rain was falling at a rate of over 115.5 mm/hr (~4.5 inches) near Chantal's center of circulation. This simulated 3-D view, looking from the west, uses TRMM's Precipitation Radar (PR) instrument to show the very powerful storms near Chantal's center of circulation

TRMM Sees Cosme Peaking

The TRMM satellite had a perfect view of hurricane Cosme when it was close to peak intensity. TRMM passed directly over head on June 25, at 2157 UTC (2:27 PM PDT). At that time hurricane Cosme was estimated to have winds of over 70kts (~80.5 mph). TRMM's Precipitation Radar (PR) saw very heavy rainfall in powerful storms on the southwest side of Cosme's eye. TRMM's 3-D Precipitation Radar (PR) data shows that Cosme had a ragged eye wall. The highest thunderstorm tops, reaching heights of about 13km (~8.1 miles), were found by TRMM PR to be located in the northeast side of the eye wall. Click

Tropical Storm COSME Becoming Stronger

Tropical storm Cosme was illuminated by morning sunlight when the TRMM satellite flew over on June 24, 2013 at 1304 UTC (8:04 AM PDT). COSME had become much better organized since being upgraded to a tropical depression 24 hours earlier. A rainfall analysis derived from TRMM's Microwave Imager (TMI) and Precipitation (PR) data are shown overlaid on a visible/infrared image from TRMM's Visible and InfraRed Scanner (VIRS). TRMM PR found rain falling at a rate of over 113 mm/hr (~4.4 inches) just to the south of Cosme's center of circulation. TRMM's Precipitation Radar (PR) data were used to show

Tropical Storm Barry Forms & Makes Second Landfall

As predicted by the National Hurricane Center (NHC), tropical depression two strengthened in the Bay Of Campeche and became tropical storm Barry on Wednesday June 19, 2013 at 1:45 PM CDT (18:45 UTC). Barry's center of circulation made landfall today just north of Veracruz, Mexico between 1200 and 1300 UTC with 40kt(~46 mph) winds. The NHC has forecast that heavy rainfall from Barry "could cause life-threatening flash flooding and mud slides..." This image uses data captured when the TRMM satellite had a good view of tropical storm Barry on June 20, 2013 at 1510 UTC (10:10 AM CDT). A rainfall