How does the water cycle work?

Water molecules are heated by the sun and turn into water vapor that rises into the air through a process called evaporation. Next, the water vapor cools and forms clouds, through condensation. Over time, the clouds become heavy because those cooled water particles have turned into water droplets. When the clouds become extremely heavy with water droplets, the water falls back to earth through precipitation (rain, snow, sleet, hail, etc). The process continues in a cyclical manner.

Learn more about Earth's water cycle on the Precipitation Education website.

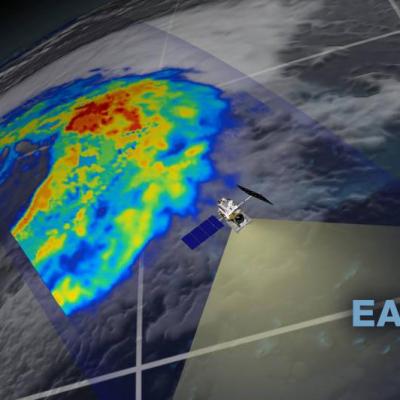
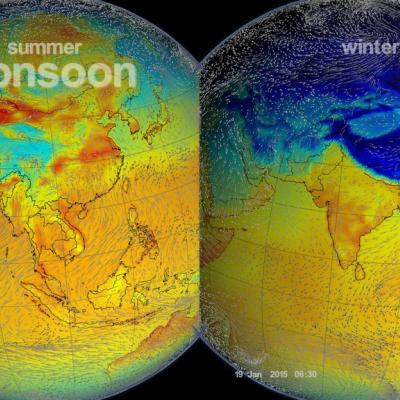
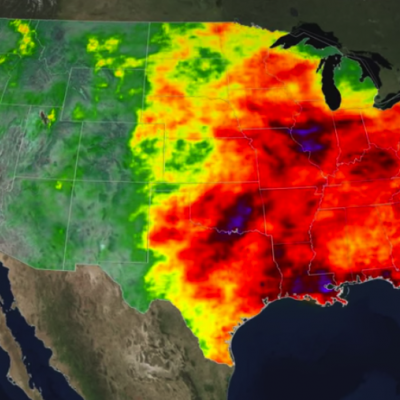
Freshwater seems abundant, but when accounting for all the water on Earth, it's in limited supply. Just three percent of the water on our planet is freshwater. A majority of this water, about two percent of the world total, is contained in glaciers and ice sheets or stored below ground. The remaining one percent is found in lakes, rivers and wetland areas or transported through the atmosphere in the form of water vapor, clouds and precipitation. Rain and snowfall replenish freshwater sources, making it vital to know when, where and how much water is falling at any given time. Using NASA's Global Precipitation Measurement satellite, researchers can track precipitation worldwide and monitor levels from space.

For more information, visit http://water.usgs.gov/edu/earthwherew...

This video is public domain and can be downloaded at: http://svs.gsfc.nasa.gov/goto?11619

Related Articles
World Resources Institute Ethiopia
NASA’s Earth observation data are used in a wide variety of ways to improve life for humans and other animals across the world every day. Our climate is changing, and these changes include differences in temperature and precipitation patterns around the globe. As you might imagine, these changes bring about both anticipated and unanticipated consequences that have a profound impact on people around the world. Many organizations are responding to the amazing yet complicated wealth of data that can be used to successfully monitor many aspects of our global environment. The World Resources
Water next to a desert.
So Much Data, So Little Time NASA’s Earth-observing data are used daily in a wide variety of ways to improve life for humans and animals across the planet. Our climate is changing, and these changes are having a profound impact on communities and species in many ways. Changing extremes in precipitation and temperature are leading to a decline in species diversity, modification to ecosystems and animal habitats, as well as changing how some species interact with each other. To address this, many organizations are turning to the amazing yet complex wealth of Earth data, which can be used to
Farmer in a field in El Salvador
To reduce risks from natural disasters and build climate resilience, decision makers are using NASA Earth observations to develop index-based insurance products and protect low-income customers in Central America, especially in the region known as the Dry Corridor.
GPM Earth Day 2020 Banner
On April 22, 2020, people around the world will celebrate the 50th anniversary of Earth Day, embracing our commitment towards understanding the planet’s environmental processes and protecting it for future generations. In support of this global event, NASA is highlighting the agency’s contributions to the environment with a week of online events, stories, and resources.
Field in Pakistan
Download this video from the NASA Goddard Scientific Visualization Studio Today, India is among the world’s most water-scarce countries. This means that it does not have enough freshwater resources to meet the needs of all the people who live there. Mismanagement of water resources have largely contributed to the country’s limited water supplies. A growing competition over finite water resources will have serious implications for Indian farmers, as well as India’s food security. More than 70% of India’s population rely on agriculture as a source of livelihood. Even more so, an estimated 82% of...
IMERG rainfall totals from Australia in November 2019
Droughts and dry, arid conditions are naturally occurring phenomena in Australia. Such an environment is conducive to wild fires, which are started mainly by lightning and can occur throughout the year, but typically emerge between October and April and are most prevalent during the Southern Hemisphere summer; they are part of the seasonal cycle in Australia. However, some years are worse than others, and the 2019-2020 wild fire season was especially bad. It has been estimated that upwards of 46 million acres were burned, or roughly the size of the entire state of Washington. In terms of area...
IMERG Sees a Dry September
Rainfall was scarce across much of the country in the month of September, pushing the eastern and southern thirds of the country into drought conditions. IMERG, the Integrated Multi-satellitE Retrievals for GPM, is a unified satellite precipitation product produced by NASA to estimate surface precipitation over most of the globe.
Using the IMERG Long-term Precipitation Data for Applications
A long precipitation data set like the new GPM IMERG V06 product is valuable for many applications and for decision-making. Accurate and reliable precipitation records are not only crucial to understanding trends and variability but also for water management resources and food security, ecological management, and weather, climate and hydrological forecasting. Here we present a few highlights showcasing how GPM IMERG is helping a variety of end users make decisions that will benefit society for years to come. GPM IMERG Data Used for Wind Energy Map of average precipitation in north-central...
Monsoons: Wet, Dry, Repeat
Credit: NASA/Goddard/Ryan Fitzgibbons This video is public domain and along with other supporting visualizations can be downloaded from the Scientific Visualization Studio The monsoon is a seasonal rain and wind pattern that occurs over South Asia (among other places). Through NASA satellites and models we can see the monsoon patterns like never before. Monsoon rains provide important reservoirs of water that sustain human activities like agriculture and supports the natural environment through replenishment of aquifers. However, too much rainfall routinely causes disasters in the region...
A Tale of Two Extremes: Rainfall Across the US
The United States has seen a tale of two extremes this year, with drenching rains in the eastern half of the country and persistent drought in the west. A new visualization of rainfall data collected from space shows the stark contrast between east and west for the first half of 2015. The accumulated precipitation product visualized here begins on Jan. 1, 2015, and runs through July 16, 2015. This visualization shows the heavy rainfall throughout Northern Texas and across Oklahoma as well as the drought in Southern California. Credits: NASA Goddard's Scientific Visualization Studio Download...