Tropical Depression Twelve Upgraded To Tropical Storm Ignacio
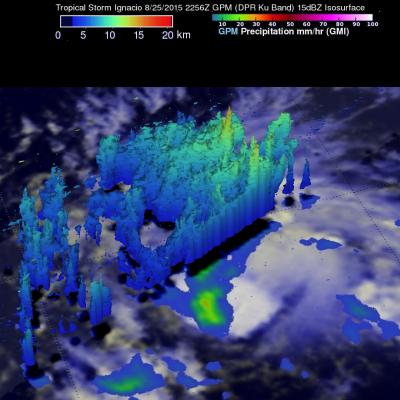
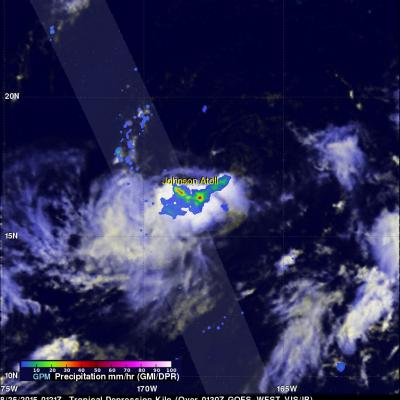
Today tropical Storm Ignacio became the 16th 2015 tropical cyclone to form in the eastern Pacific this year putting it a couple weeks ahead of last year’s pace. The GPM core observatory satellite saw Ignacio on August 25, 2015 at 2256 UTC. GPM’s Dual-Frequency Precipitation Radar (DPR) found rain falling at a rate of over 74 mm (2.9 inches) per hour with storm tops reaching to altitudes of close to 15 km (8.7 miles).