Extreme Weather News

Jump to a Year

2024 | 2023 | 2022 | 2021 | 2020

2019 | 2018 | 2017 | 2016 | 2015

2014 | 2013 | 2012 | 2011 | 2010

2009 | 2008 | 2007 | 2006 | 2005

2004 | 2003 | 2002

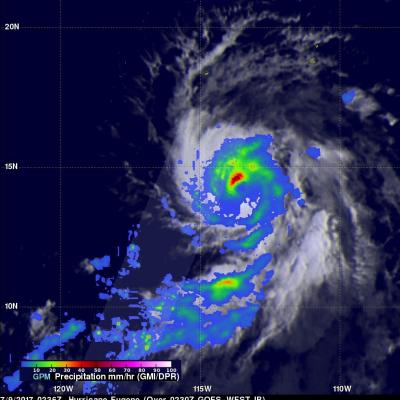
Eastern Pacific Hurricane Viewed By GPM

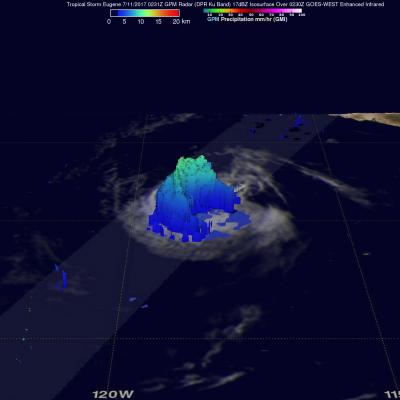
Hurricane Eugene formed on July 7, 2017 in the eastern Pacific Ocean south of the Baja Peninsula. Eugene was intensifying when the GPM core observatory satellite flew over on July 9, 2017 at 0236 UTC. Eugene reached it's peak power later that day with it's maximum sustained wind speeds reaching about 100 kts (115.0 mph). The center of GPM's track passed to the west of Eugene's eye. Data collected by GPM's Dual-Frequency Precipitation Radar (DPR) instrument showed that powerful storms in the northwestern quadrant of the hurricane were dropping rain at a rate of over 186 mm (7.3 inches) per hour

GPM Sees Possible Tropical Cyclone Forming

A low pressure system in the Atlantic Ocean west-southwest of the Cabo Verde Islands is being closely monitored for possible development into a tropical depression. The GPM core observatory satellite flew over this area on July 5, 2017 at 5:47 AM EDT (0947 UTC). GPM's Microwave Imager (GMI) and Dual-frequency Precipitation Radar (DPR) showed that heavy showers were located in this area. GPM's GMI data indicated that rain was coming down at a rate of greater than 44.2 mm (1.74 inches) per hour in one cluster of storms. GPM's radar (DPR Ku band) measured precipitation falling at rate of over

GPM Views Intensifying Tropical Storm Nanmadol

The GPM core observatory satellite flew above tropical storm NANMADOL on July 2, 2017 at 2306 UTC. The intensifying tropical storm was located just northeast of Taiwan and had maximum winds estimated at 45 kts (51.8 mph). The GPM Core Observatory carries the first space-borne Ku/Ka-band Dual-frequency Precipitation Radar (DPR) and a multi-channel GPM Microwave Imager (GMI). Rainfall within NANMADOL was derived from data collected by GPM's GMI and DPR instruments. Those data indicated that rain was falling at a rate of greater that 184 mm (7.2 inches) per in powerful storms northeast of the

NASA's IMERG Shows Cindy's Extreme Rainfall

Tropical storm Cindy was downgraded to a tropical depression after moving onshore near the Texas and Louisiana Border on Thursday June 22, 2017. Flooding was reported along the the Gulf Coast even before Cindy made landfall. The rainfall around tropical storm Cindy was asymmetrical. The majority of heavy rainfall with the tropical cyclone was located east of Cindy's center in the states along the Gulf Coast from Louisiana through the Florida Panhandle. The tropical depression continued to spread heavy rain and occasionally severe thunderstorms after it came ashore. Severe thunderstorms spawned

GPM Satellite Sees Cindy Drenching Gulf Coast

The GPM core observatory satellite passed above as tropical storm Cindy was approaching the western Louisiana coast on June 22, 2017 at 1:21 AM CDT (0621 UTC). Cindy had maximum sustained winds of about 40 kts (46 mph) at that time. A red tropical storm symbol shows Cindy's approximate location. Rainfall derived from Microwave Imager (GMI) and Dual-Frequency Precipitation Radar (DPR) measurements showed that there was very little rainfall near Cindy's center of circulation but bands of moderate to heavy showers are shown moving into the states along the Gulf Coast. GPM's Radar (DPR Ku Band)